Bitcoin invalidated the short-term pattern posted last month as it pulled both sides’ triggers and then returned to the current equilibrium. The other large-scale pattern is good to go.
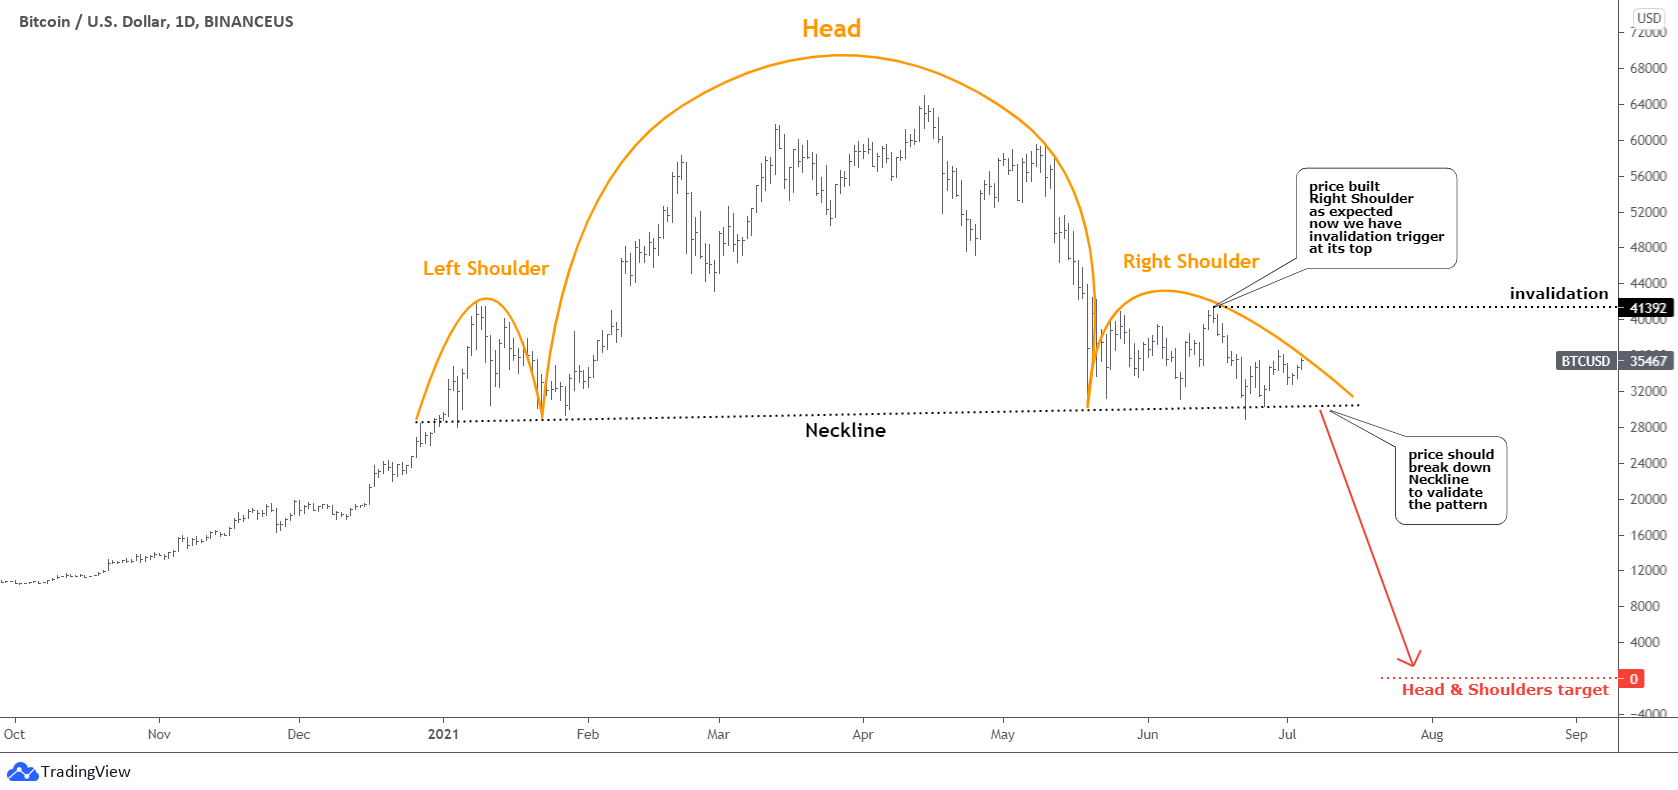
I assumed that the right shoulder has been in progress with a possible spike to the upside. The price accurately followed that forecast as the price even surpassed the previous top to mirror the extreme in the left shoulder. Both shoulders peaked almost in the same area as the entire pattern aligns horizontally.
The pattern is complete now as we finally have the invalidation at the top of the right shoulder at $41,392. The downward trigger is the Neckline around the $30k level. The price of Bitcoin has pierced it only once without a follow-through breakdown.
The majority of readers chose the crash option for Bitcoin.
The hype could not save Ethereum from a huge collapse amid the entire crypto-market sell-off. The price dropped beneath the common Fibonacci retracement levels. The structure has changed then.
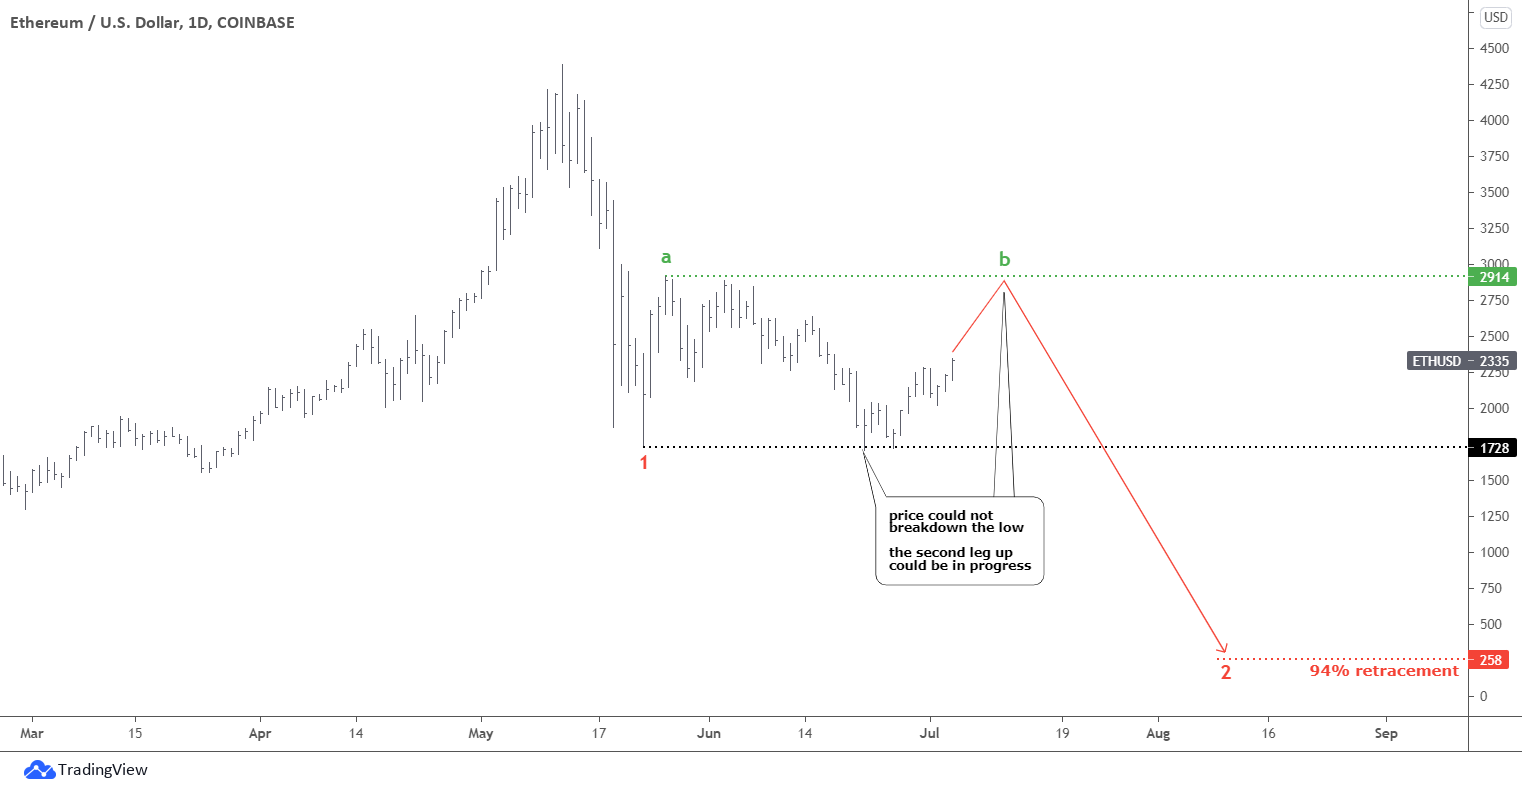
The price collapsed to the low of $1,728. After that, it started to recover robustly, almost reaching the 50% pullback area. The top was established at $2,914, and then the price crashed again.
I marked that pullback as green “a” leg because the following drop could not break down the former valley of $1,728. It means that the second green leg “b” could be in progress. The top of the leg “a” at $2,914 is the target for leg “b” as it looks like the box-type horizontal consolidation.
This two-legged pullback is an interconnector between red legs 1 and 2 to the downside. If we assume that the consolidation would emerge as per the plan, we can find the preliminary target for the second leg down. The equal distance with leg 1 could reach the $258 level in leg 2. It will be a 94% retracement of the entire move up post the 2018-year crash, the same retracement we had in the mentioned 2018 collapse.
Ripple (XRP) follows the trajectory set with the breakdown of a Triangle pattern posted in May. Most readers preferred the “I don’t trade Ripple” option followed by the bullish bet. This time, the least popular option of downward movement has played out.
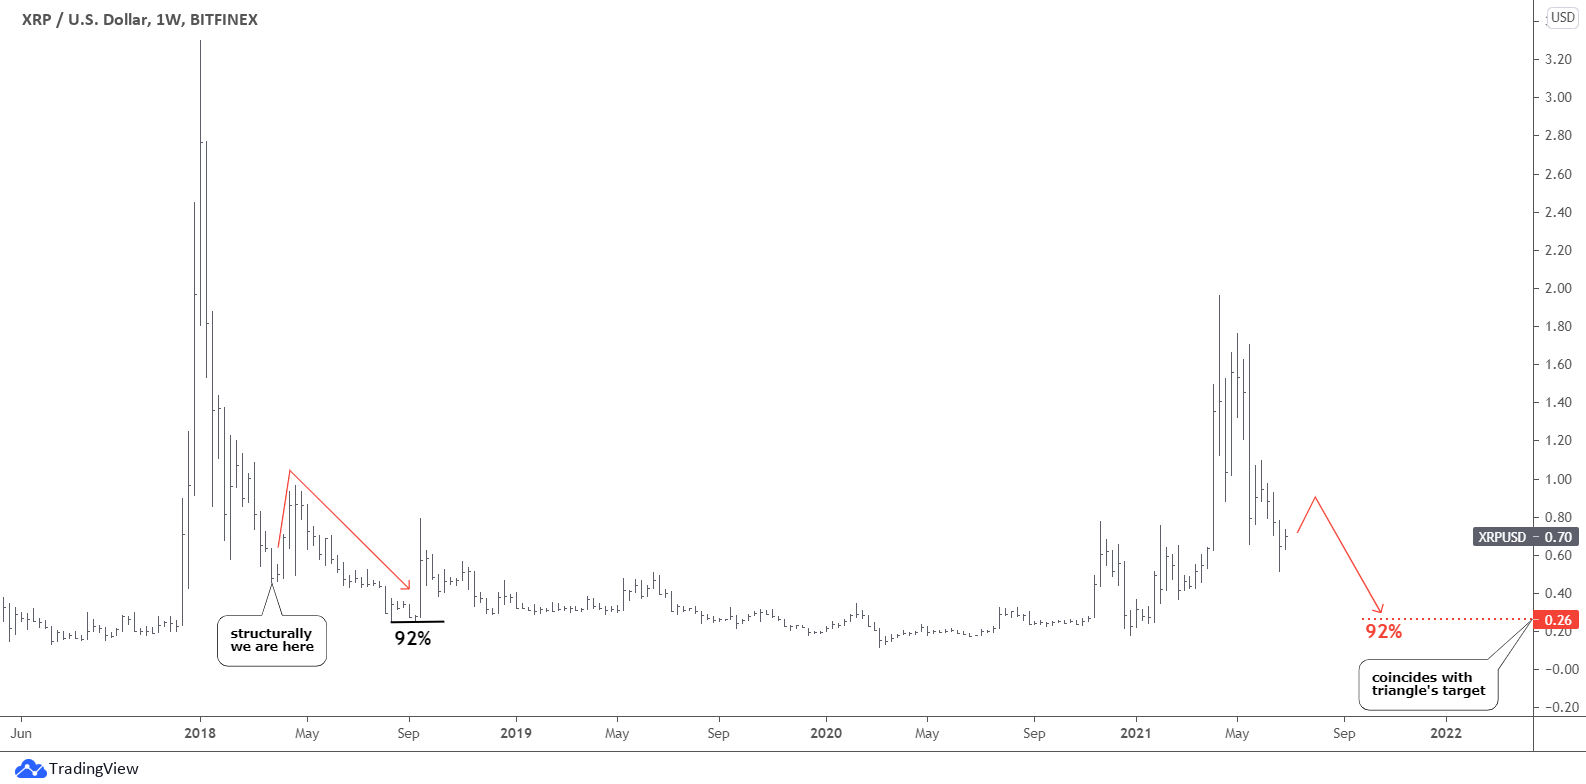
It looks like the XRP price falls prey to the distribution stage when investors get rid of the asset. I zoomed out the chart to show you the historical pattern of that stage. Yes, it is not a new thing for the Ripple as in not so distant 2018, the price retraced heavily into the abyss of 92%, down to $0.25 from the peak of $3.30.
If we apply the historical correction percentage to the current situation, the target level for the drop could be in the area of $0.26. It amazingly coincides with the initial downward target of a Triangle.
Overall, this could build a large corrective structure. We have one fast move to the upside to peak at $3.30 in 2018 and the following long-lasting retracement within two legs to the downside. In this case, we cannot rule out the full retracement to tag the all-time low of $0.13 to complete the entire structure.
Retracements or even total extinction threat well-known cryptocurrencies as the global “green” agenda is acute these days. The central banks are also strong opponents as they are eager to roll out their own digital currencies, although with the same fiat virtue. More and more established institutional investors, on the other hand, admit that cryptos as an asset class came here for long.
Indeed, the first cars were not environmentally friendly; the first aircraft were unsafe, but we still use both types, although none of the prototypes survived.
Investors have poured more than one trillion dollars into this market for some reason. Let it be a digital escape, anti-inflation/fiat, gambling, etc. The coins as “products” could change or even be substituted; however, the crypto-market would continue.
Intelligent trades!
Aibek Burabayev
INO.com Contributor, Metals
Disclosure: This contributor has no positions in any stocks mentioned in this article. This article is the opinion of the contributor themselves. The above is a matter of opinion provided for general information purposes only and is not intended as investment advice. This contributor is not receiving compensation (other than from INO.com) for their opinion.


Hello Aibek - would you be willing to provide your latest analysis of Bitcoin? For example, was this past week a bottom or are we still in danger of further collapse down to the $20K range? Thanks!
Dear Bob,
It’s time to update the chart indeed.
Please stay tuned as I am going to do it earlier next week.
Best wishes, Aibek
"Defi" is probably the subject of this link: https://techcrunch.com/2021/07/07/defi-investor-platform-zerion-raises-8-2-million-series-a/