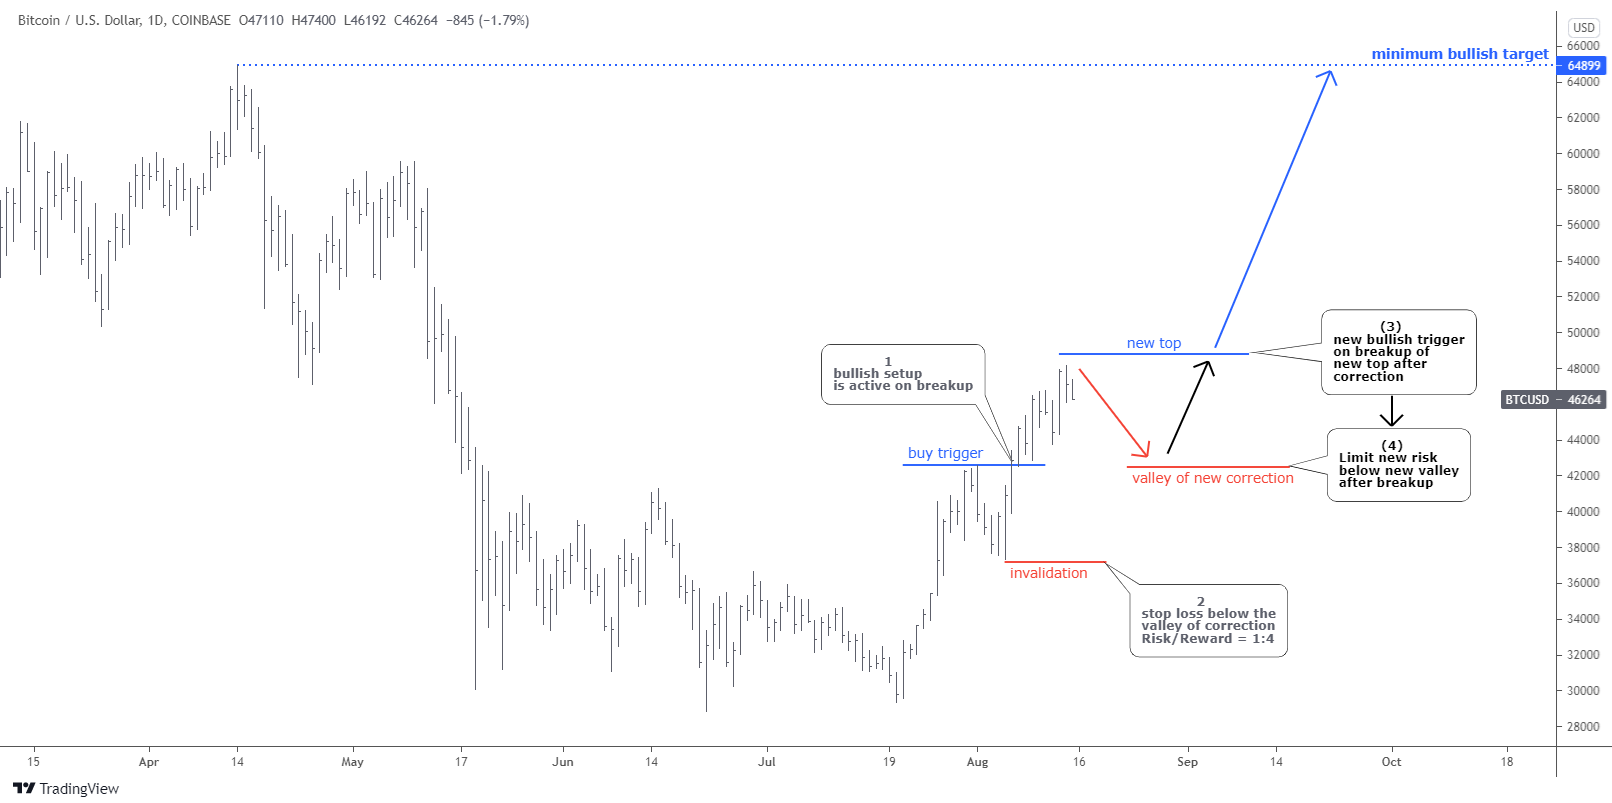
It looks like I have posted the Bitcoin Bullish Setup at the right time as the price precisely followed the preset path - first down into a correction, which hit the minimum area of 38.2% Fibonacci retracement level. Then up to break above the first minor top, that activated the buy trade setup.
The majority of readers were bullish, with 61% votes.
We can see the clear difference between outlooks and setups. I posted both the Bullish setup and the Bearish setup in case the correction would be extended. They were based on opposite outlooks. We do not have to guess; we wait for which setup would work.
The Bullish setup is on now, and the progress is visible as the price reached the area where the current profit is already equal to the amount of a potential loss; in other words, the reward is already matching the risk taken. Thus, the overall risk/reward ratio is 1:4.
I added another Bullish Setup if someone is going to add or enter here. The strategy remains unchanged. One should watch if a new correction from the new top would emerge, then wait for the breakup (3) of that top, which would trigger the trade setup. The valley of a new correction (4) would act as a stop loss area for a new trade. The bottom of a former correction (2) at $37k is the total invalidation trigger for first and current entries.
If someone is going to add, it is better to move the first trade’s stop-loss into a breakeven after the price would trigger the new buy setup to risk only on the next trade.
What about “Dead Cat Bounce”? Interestingly, the bearish structure of an ongoing large complex correction simultaneously gathered the most likes amid the strong support of the Bullish Setup shown above.
The model is still valid as the price hit only the 50% Fibonacci retracement level beyond the $47,196 and can drop anytime. However, it is far from being activated, as we should wait for a confirmed reversal first.
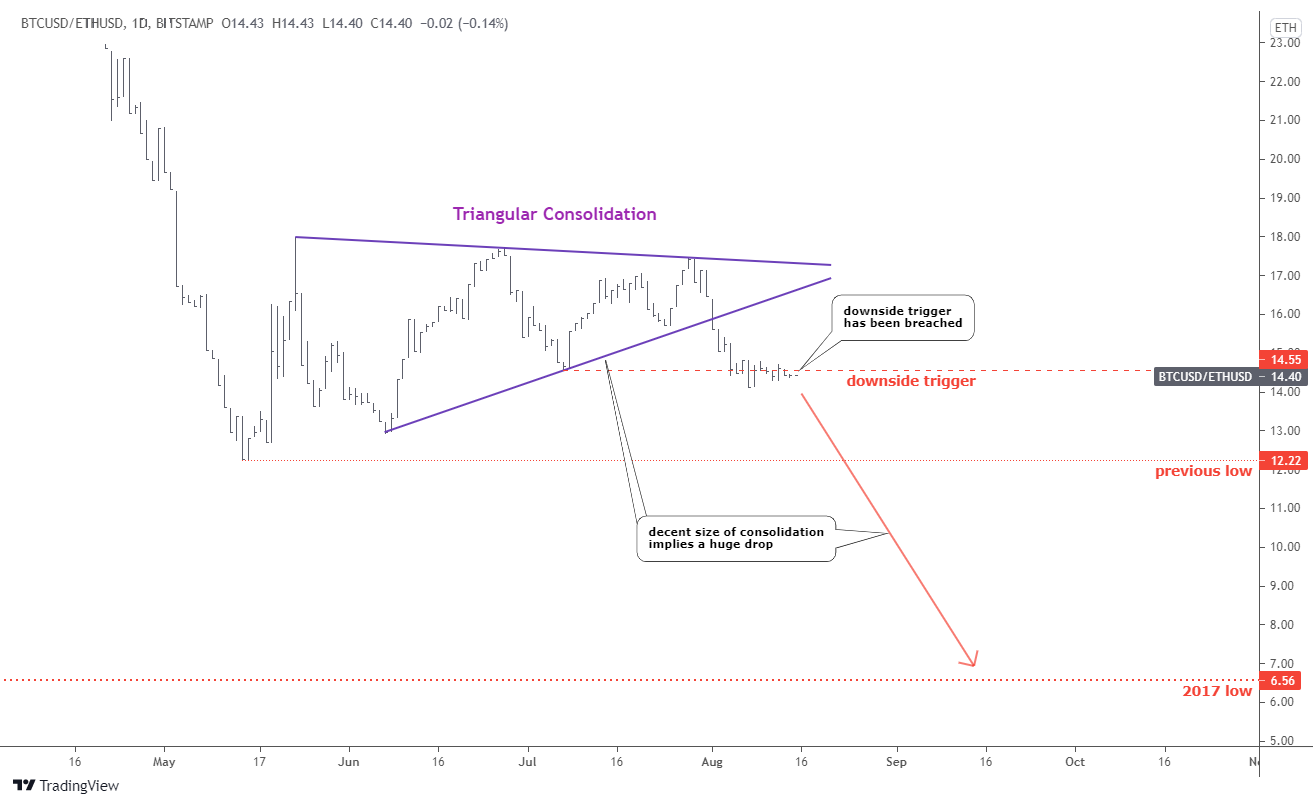
The next chart shows an interesting price development of the Bitcoin/Ethereum ratio.
I spotted a sideways consolidation within a contracting Triangle pattern (purple). It is a sign of a continuation of a prevailing trend to the downside. The ratio already breached below both the pattern and the downside trigger. The next support is located at the previous low of 12 ETH.
A decent size of a Triangular consolidation implies a huge drop to follow. The bearish target has remained unchanged since May at 6.56 ETH in the valley of 2017.
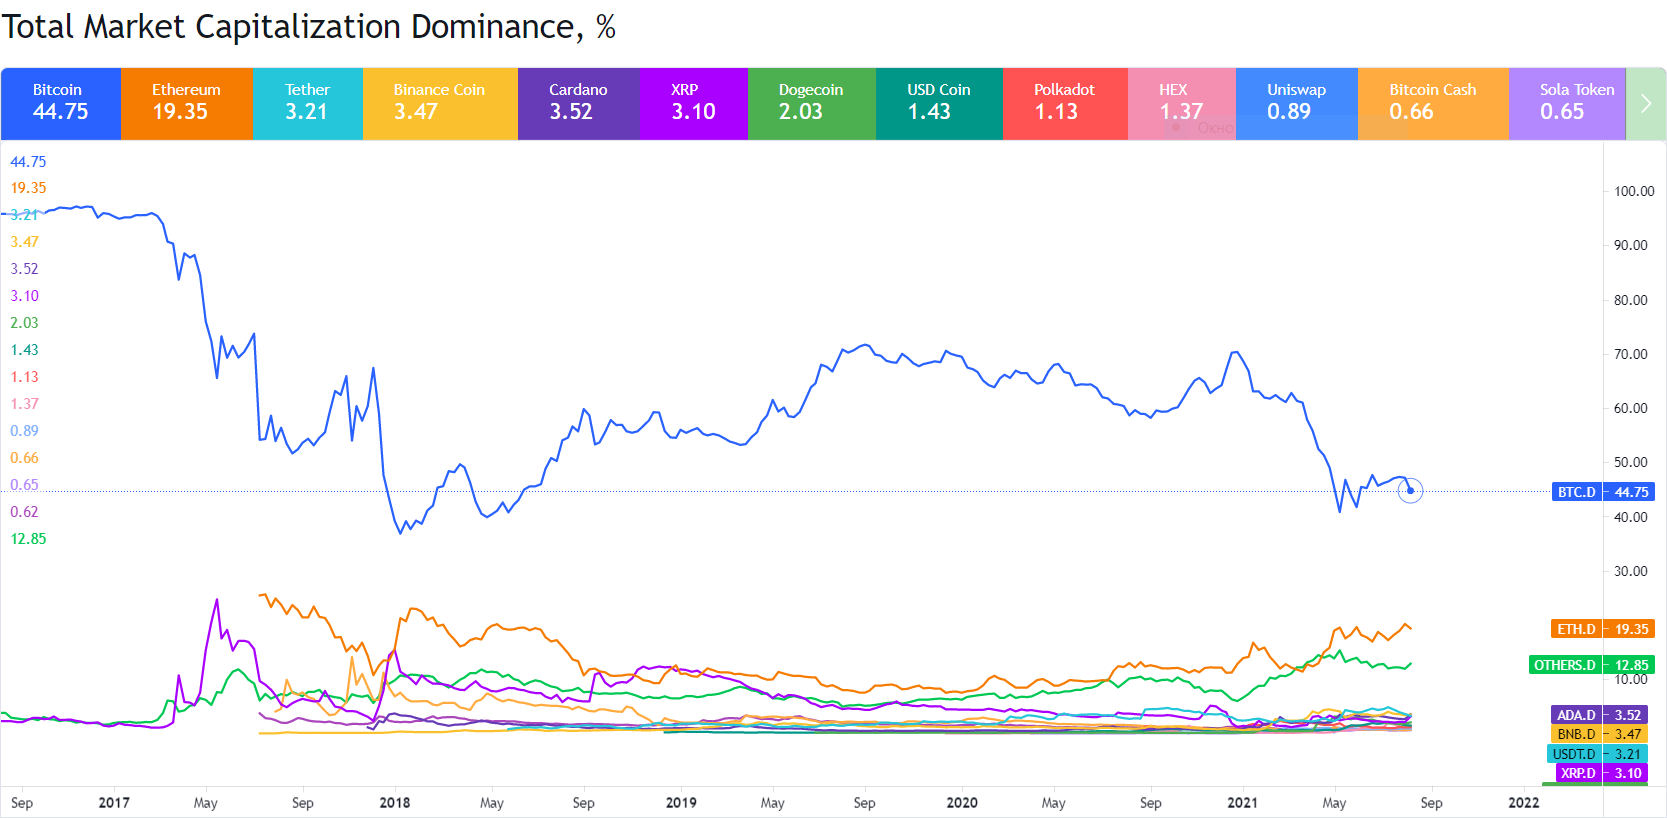
The following graph displays the Total Market Capitalization Dominance.

Chart courtesy of tradingview.com
The main has coin lost its utter dominating position in 2017-2018. The collapse of the market share was sharp and huge, as it has sunk below the crucial fifty percent. However, the following bounce brought it back to seventy percent of the market, and Bitcoin had it in a firm grip for three years.
This year it lost the shine, it was huge again as the market share is back under the half nowadays. Ethereum is raising its head to fight back the place in the sun with a current market share of nineteen percent. It still has the room to get back its historical top of twenty-six percent established in 2017. Ethereum is the only viable competitor of Bitcoin according to market share trends.
Intelligent trades!
Aibek Burabayev
INO.com Contributor, Metals
Disclosure: This contributor has no positions in any stocks mentioned in this article. This article is the opinion of the contributor themselves. The above is a matter of opinion provided for general information purposes only and is not intended as investment advice. This contributor is not receiving compensation (other than from INO.com) for their opinion.


