Bitcoin was in the “To Be Or Not To Be” situation last month as the giant Head & Shoulders pattern emerged to target the utter annihilation of Bitcoin.
This strong support that most of you have shown in the last poll for the main coin kept it from the collapse into the abyss. Let me show you on the chart below what has happened with the terrifying pattern since then.
The model looked just perfect as the price reached the final trigger of the Neckline after building the anticipated Right Shoulder to accumulate enough power for the breakdown. However, the first attempt in late June has failed. The next attempt at the end of July was not as powerful as the angle of attack was not sharp enough, and momentum quickly evaporated after a false breakdown.
The price area between $28k and $29k acted as a big barrier as both attempts failed there.
Last week, the model was technically and visually broken as the price overcame the invalidation trigger beyond $41,392, and the Right Shoulder got overextended, violating the symmetry.
The strong move up in Bitcoin is yet to seal the reversal as I can see at least two opposite scenarios these days based on different views on current consolidation.
Let us start with a bullish one, as we can build a trade setup there.
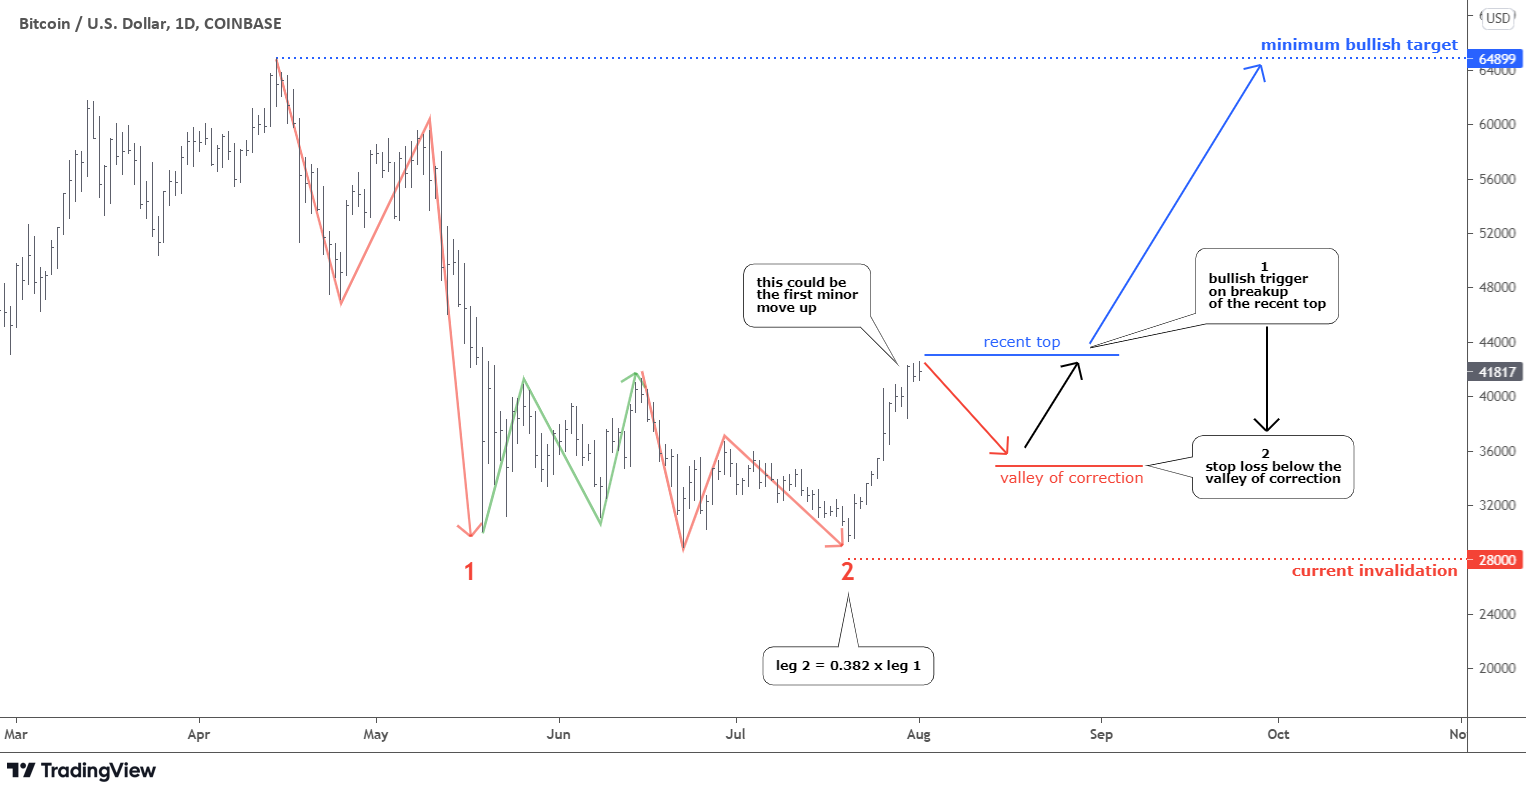
This outlook is based on the assumption that the correction is over already. It reached almost 61.8% Fibonacci retracement level. The correction consists of two red zigzags down and a green joint. The first leg down is huge and sharp as the second leg is small as it is equal only to the 0.382 of the size of leg 1. It is not a typical situation, but it occasionally happens, especially when there is too much hype/focus that we witness in Bitcoin lately.
The bullish move that invalidated the Head & Shoulders pattern could be the first minor move to the upside. The bullish setup should be tailored as follows. Traders need to wait for the visible correction that should follow this upside move in the first place, as its valley will be the area of the future stop loss. The price should keep above the current invalidation trigger above $28k. The bullish trigger is located on the breakup of the recent top. We cannot set it right now as the move up still could be in progress.
The minimum bullish target is located at the all-time high of $64,899. The risk/reward for the emerging setup is between 2.5 and 3.0.
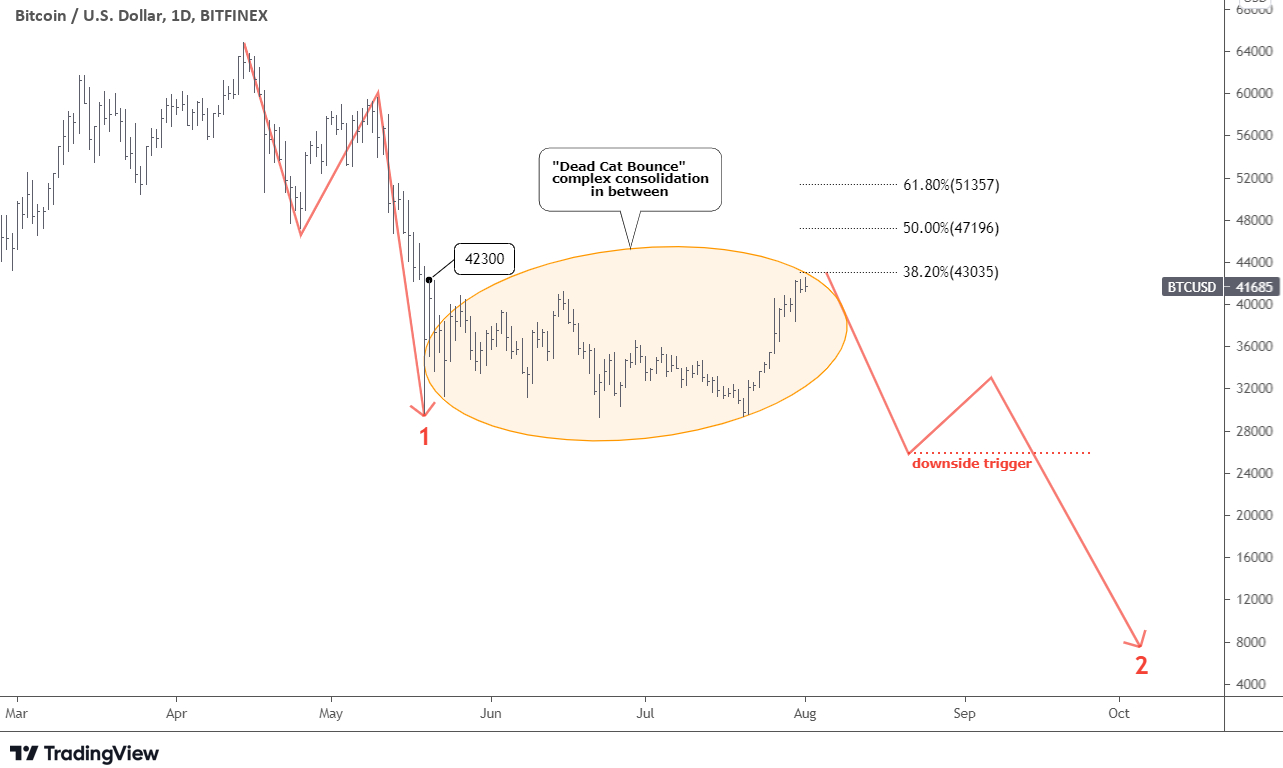
Someone could call this sharp move up a “Dead Cat Bounce,” which means the price should collapse further. So let us look at the chart the other way.
In this option, we assume that the current consolidation (orange ellipse) is still in progress as it has a complex structure. The first leg of it reached the top at $42,300 at the end of May.
Then we can see a long-lasting interconnector that retested the valley. The final leg up could be in progress these days as it already retested the top of leg 1. Both legs almost reached the 38.2% Fibonacci retracement level. I added the 50% and 61.8% as well for guidance. The next resistance is located at $47k.
The consolidation could be over soon as both legs are equal already. The next drop could touch the $8k area if leg 2 emerged the same size as leg 1. The downside confirmation is set in the valley of the first minor leg down. The following correction ahead of another Bitcoin collapse should confirm the structure.
Intelligent trades!
Aibek Burabayev
INO.com Contributor, Metals
Disclosure: This contributor has no positions in any stocks mentioned in this article. This article is the opinion of the contributor themselves. The above is a matter of opinion provided for general information purposes only and is not intended as investment advice. This contributor is not receiving compensation (other than from INO.com) for their opinion.


