
As the Real Estate market shifts away from super-low interest rates and skyrocketing home prices throughout the COVID-19 crisis, we are starting to see the Real Estate ETFs weaken in trend and start to move lower. The recent rising Mortgage Rates will likely continue to weaken sales trends and push home prices a bit lower over the next few months. The Real Estate ETF, IYR, is already reflecting a roughly 10% decline in valuation since early September 2021.
In the first part of this research article, I shared a historical chart of the US Average Mortgage rate and some data suggesting the average US consumer is somewhat bound to certain home price constraints based on Average Income. Typically, mortgage payments should stay below 50% of the borrower’s total take-home income. Depending on the borrower and the home price, many US borrowers may already be priced out of the market – even with 3.25% interest rates.
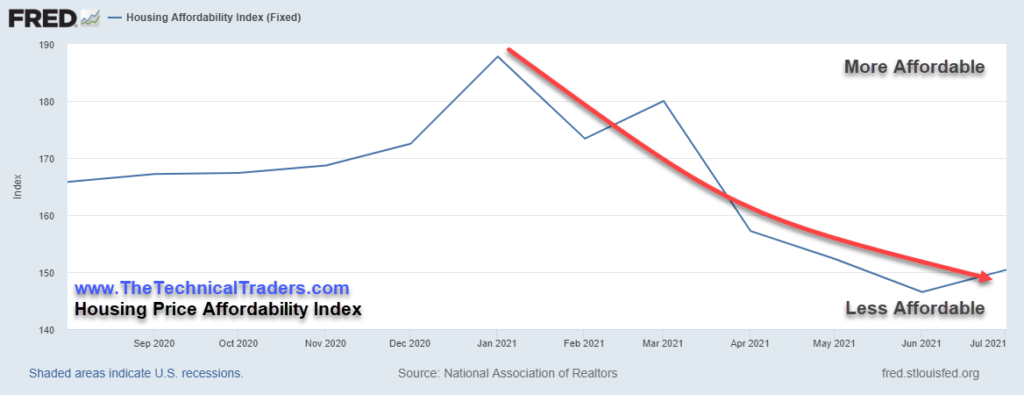
Peak Home Price Affordability Was Reached In Early 2021
Peak affordability appears to have peaked in December 2020 & January 2021 – just after the COVID-19 crisis. This likely correlates to the lower interest rates, at one point below 2% in most of the US, for home buyers while home prices were 20% to 40% lower than they currently are in most areas.
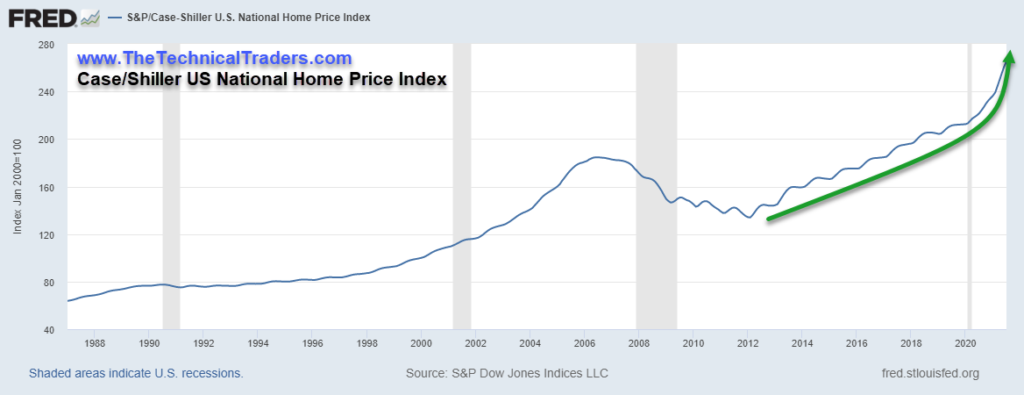
Case/Shiller National Home Price Index Has Skyrocketed 30% Higher Since May 2020
A great measure of the National Average Home Price is the Case/Shiller US National Home Price Average Index. From the chart below, you can see the almost parabolic rise in home prices after the March 2020 COVID-19 event. This incredible rally represents a 30%+ increase in home average US home prices in a little over 13 months. There is nothing similar on this chart, going back to 1988. This likely means the process of the COVID-19 virus event created a perfect transitional storm for the housing market – where strong earners may have relocated into more rural areas or taken on a second or third home while interest rates were favorable. But for the average home buyers (first-time or young adult), this may have pushed home price affordability well past reasonable levels.
It will be interesting to see how the Real Estate market deals with the new spending and tax policies that are being pushed through Congress right now – as well as if this trend can continue much longer with the threat of the US Fed raising interest rates.
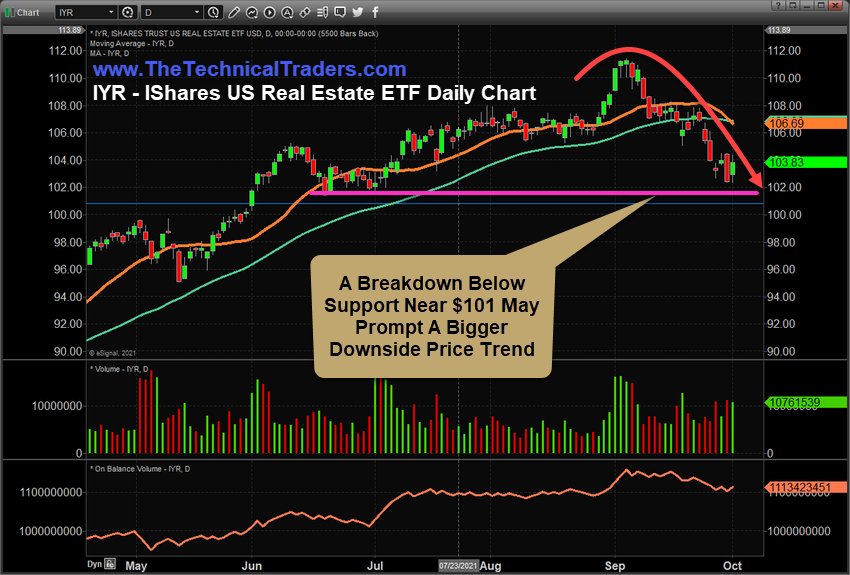
Real Estate ETFs Are Already Showing Signs Of A Changing Market
This Daily IYR, IShares Real Estate ETF, shows how traders have reacted to the peak price and home sales activity recently. I believe the US housing market may be starting a transition that could take another 20 to 35 months to finally settle. The affordability issue for homes is one thing, but the economy must continue to expand at a reasonable rate in order for current price levels and affordability levels to be sustained.
Additionally, the uncertainty related to new policies, taxes, spending, and the US Debt Ceiling is putting additional pressure on the Real Estate market right now. The two biggest tax changes are the limits put on the Inheritance Tax Minimums (proposed at $1 million), and the Death Tax Minimums (which are being cut by near 75%). These two major changes to the tax law will greatly affect the transition of generational wealth as home prices and other assets may be taxed at far greater rates than in the past.
Putting these two rather large unknowns ahead of the already super-heated housing market, we may see IYR fall to levels below $101 if downside price pressure continues. A breakdown below $101 would indicate a strong recent support level has been breached. Suggesting a breakdown in price trend and the potential that a new bearish price trend may be setting up.
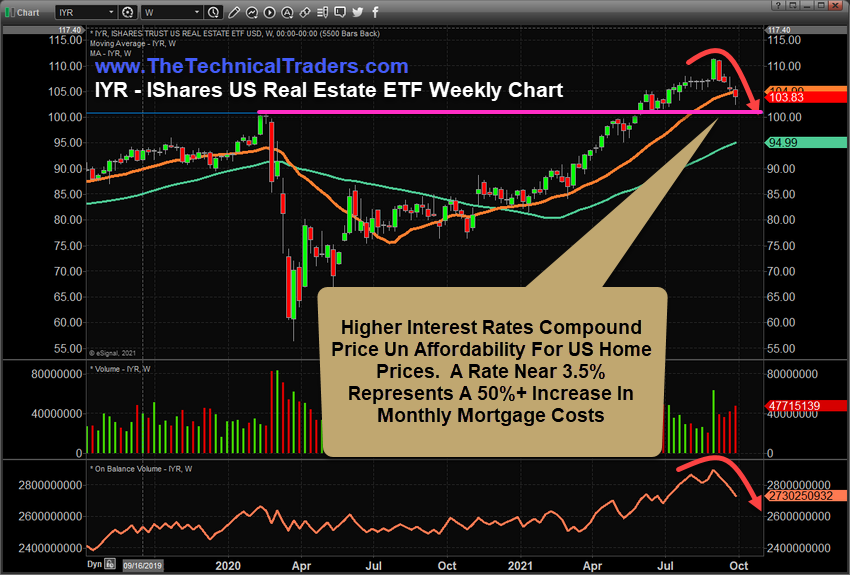
This Weekly IYR chart shows the $101 Support level originates from the high price level just before the COVID-19 virus event (in February 2020). If IYR falls below this level after the incredible rally phase over the past 14+ months, I would believe the downside potential for a move like this could push prices lower by another 15% to 25% – possibly targeting $80 to $85.
It all depends on how consumers and the US Federal Reserve act over the next 6 to 12+ months and how the US Congress acts to address the how and why of how these new spending bills are resolved. At the end of the day, the US economy has rallied extensively over the past 13+ months and now we are entering a transitory phase in the US equity markets. This will likely transition into the US housing market as well.
You don’t have to be smart to make money in the stock market; you just need to think differently. That means: we do not equate an “up” market with a “good” market and vi versa – all markets present opportunities to make money!
We believe you can always take what the market gives you and make CONSISTENT money.
Learn more by visiting The Technical Traders!
Chris Vermeulen
Technical Traders Ltd.
Disclosure: This article is the opinion of the contributor themselves. The above is a matter of opinion provided for general information purposes only and is not intended as investment advice. This contributor is not receiving compensation for their opinion.