In this post, I would like to show you what happens to the structure of the crypto market over time as new stars join the universe with hopes of taking down the shining star, Bitcoin.
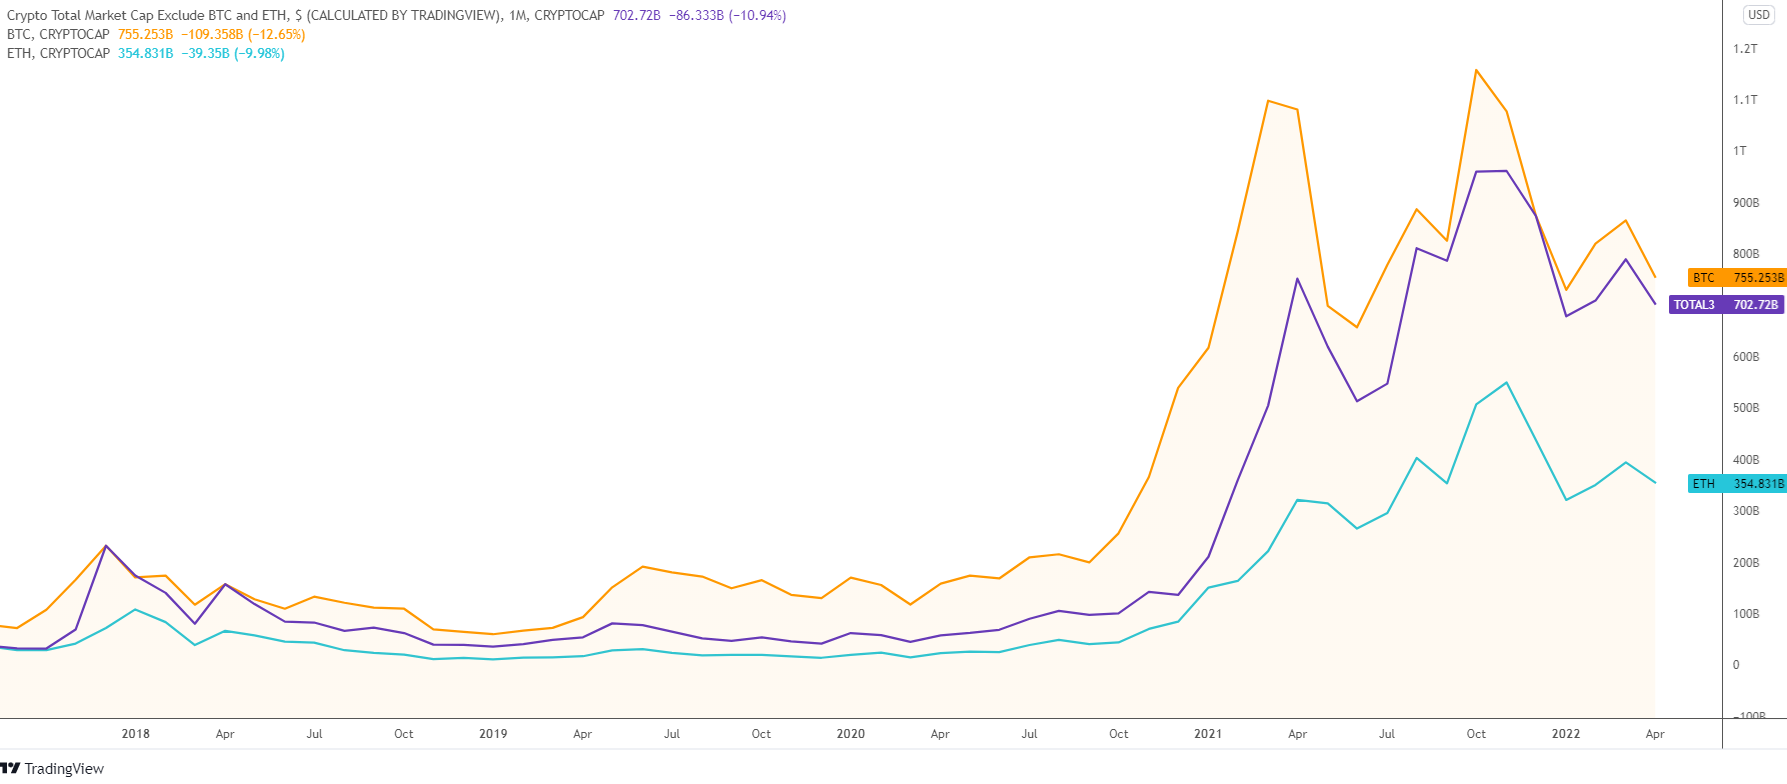
Chart 1. Market Cap Comparison: Bitcoin, Ethereum, and Altcoins
The chart above starts in September of 2017. Both altcoins and Ethereum had a market cap of around $30 billion, while the main coin had more than double that at $72 billion. The latter started to rally at once, reaching the top of $231 billion by the end of 2017. Altcoins followed Bitcoin with a delay of one month; however, the growth was more robust and the market cap caught up with that of the main coin rising more than seven-fold. It was that very rare moment when the market cap of altcoins could touch the “Sun” of Bitcoin in the considered period.
For most of the time, Bitcoin’s market cap has a great margin over altcoins that, in their turn, kept the positive gap with Ethereum. Indeed, the leading coin is the “Sun” that shines brighter than the rest of the market. During the market peaks of 2021, the altcoins could not reach Bitcoin’s market cap as they did in 2017.
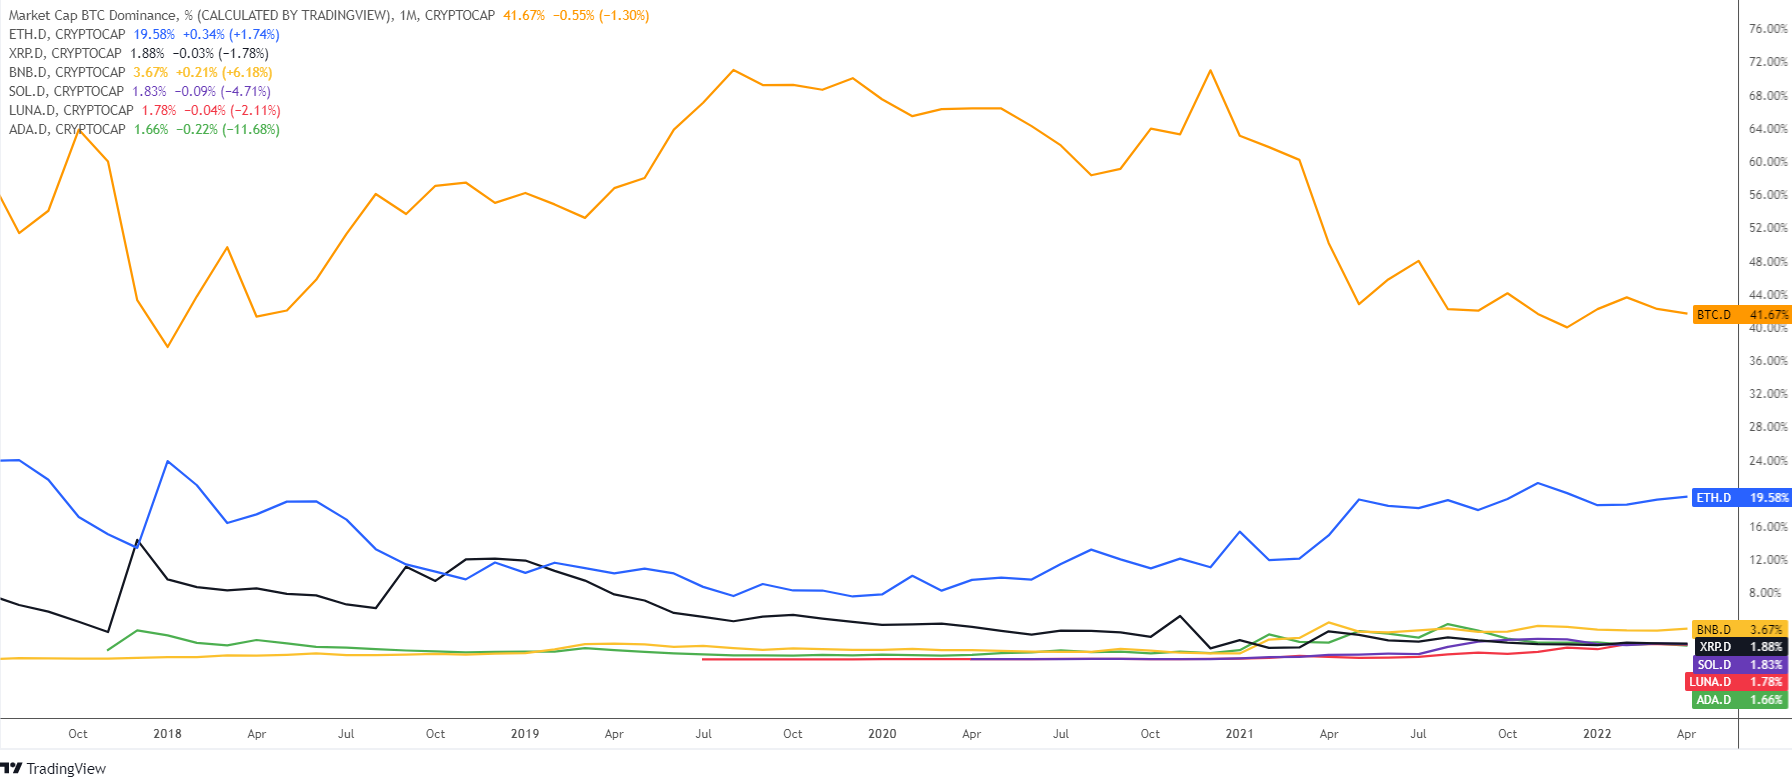
Chart 2. Crypto Market Dominance Comparison
The chart above shows the situation that is often seen in sports. There are dominating teams/athletes that once took their place in the sun and kept it with a death grip from competition to competition (championships, World Olympic Games). For the past 4 years, Bitcoin and Ethereum have kept #1 and #2 positions in the market, respectively. Their cumulative dominance stands at 61%. The leading coin sits tight above the valley of 2018 (37%), and Ethereum eyes the ceiling set in 2017 at 24%.
This situation resembles your preference expressed in the last poll where you have chosen Ethereum over Bitcoin and the main coin over the altcoin.
The remaining 39% of the market is the target of severe competition between the newbies. As you can see in the chart above, none of the contenders of the lower league could take five percent of the market in spite of the high speeds of modern market development.
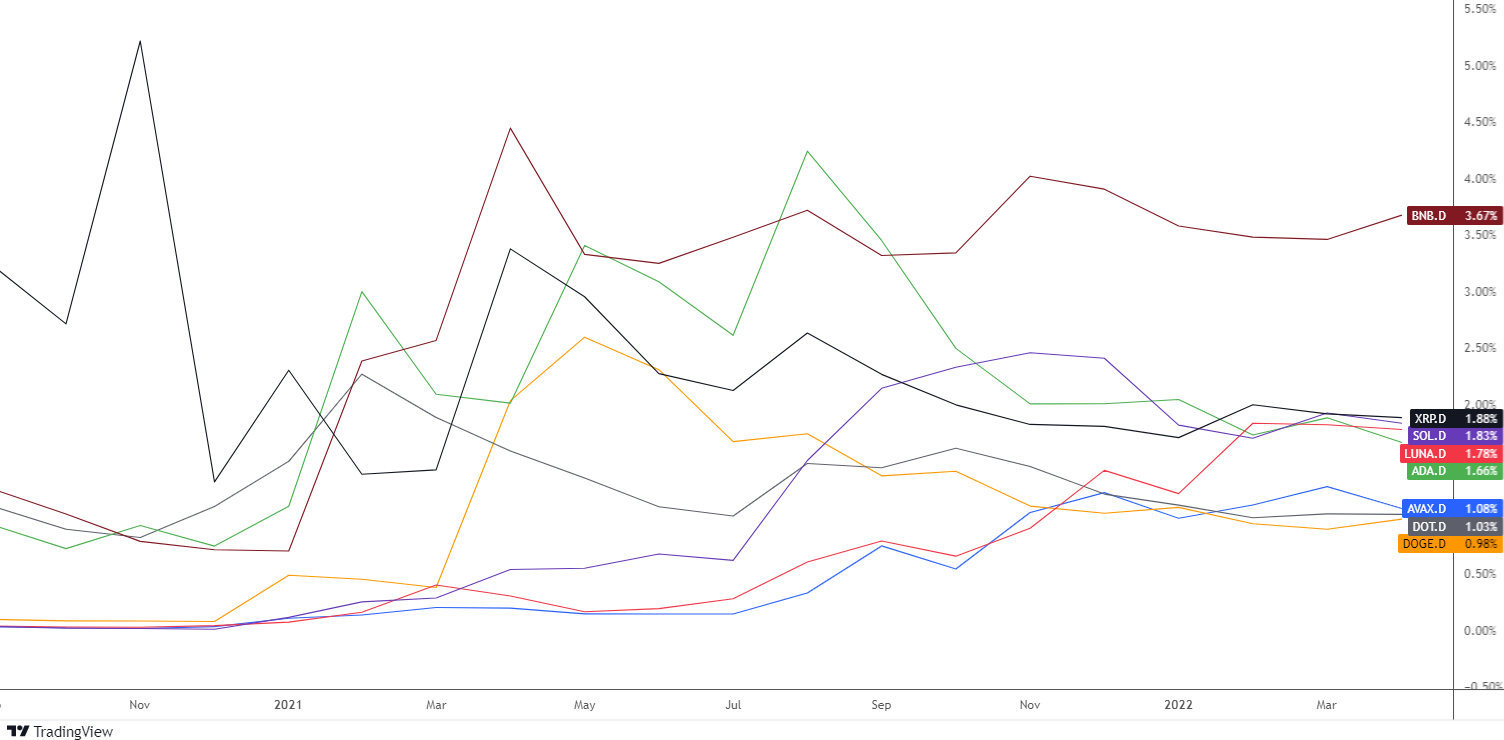
Chart 3. Crypto Market Dominance Comparison Excluding BTC and ETH
The chart above depicts the lower league of the market. We can see different stages for each cryptocurrency here as they go through boom and bust cycles either.
The leader of this niche is the coin of the largest crypto exchange Binance. The BNB holds almost four percent of the market. It gained this level a year ago, and now the trend remains flat.
The next coin opens the division of “two percent coins.” For example, Ripple (XRP) once was somewhere close to the current Ethereum position; in 2017, it peaked at 18%. It has only 1.88% of the market these days, almost ten folds smaller than in its best years.
So-called “Ethereum Killers,” Cardano (ADA) and Solana (SOL), are losing their dominance, especially the former that peaked above 4% last year on the hype. Luna is, on the contrary, on the gaining track from nothing to something.
The mighty Avalanche token (AVAX) opens the division of “one percent coins” at 1.08% market dominance. It was in an uptrend recently as this platform boasts to be blazingly fast, low cost, and eco-friendly.
The Polkadot (DOT) coin lost half of its market share since its peak last February. It looks like the hype of the “para-chain” is cooling down.
The favorite coin of Elon Musk meme Dogecoin (DOGE), repeats the trend of DOT as it also lost half of its market dominance from the peak established last year.
Intelligent trades!
Aibek Burabayev
INO.com Contributor, Metals
Disclosure: This contributor has no positions in any stocks mentioned in this article. This article is the opinion of the contributor themselves. The above is a matter of opinion provided for general information purposes only and is not intended as investment advice. This contributor is not receiving compensation (other than from INO.com) for their opinion.


bitcoins are nothing but indian wampam worth less I have BUCKET OF WASHERS IN MY GARARGE
and will sell you 5 mil. same diff