Controlling the overall systemic risk of a portfolio is essential as the markets continue to grapple with inflation, a rising interest rate environment, supply chain challenges, and the Russian/Ukraine conflict.
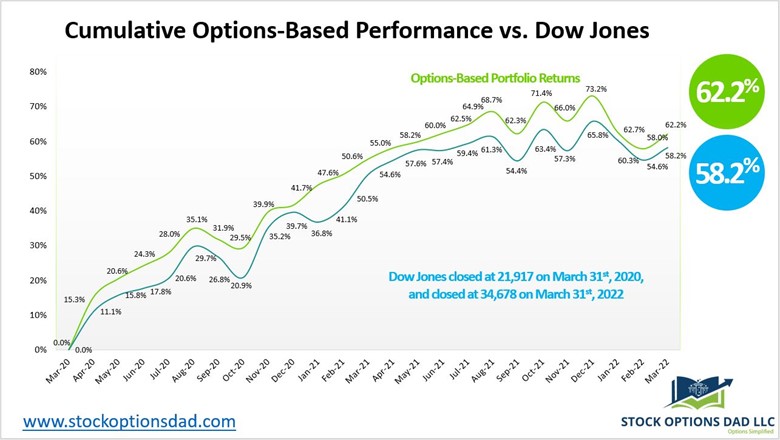
Controlling volatility while generating in-line or superior returns relative to the market is the goal of an options-based portfolio. An option-based strategy is achieved via a blended approach of options, long stock positions, and cash. Options alone cannot be the sole driver of portfolio appreciation; however, they can play a critical component in the overall portfolio construction while keeping volatility in check (Figure 1).
Generating consistent monthly income while defining risk, leveraging a minimal amount of capital, and maximizing returns is the core of an options-based portfolio strategy. They can enable smooth and consistent portfolio appreciation without guessing which way the market will move. Options enable the possibility to generate consistent monthly income in a high probability manner in various market scenarios. An options-based portfolio provides durability and resiliency to drive portfolio results with substantially less risk. Over the previous 2-year period, the portfolio strategy has consistently outperformed the Dow Jones with reduced volatility (Figure 1).
Figure 1 – Previous 24-month period of overall returns for the options-based portfolio strategy relative to the Dow Jones. All option and stock trades executed in the options-based portfolio is available via the Trade Notification Service
Options Screening Tool
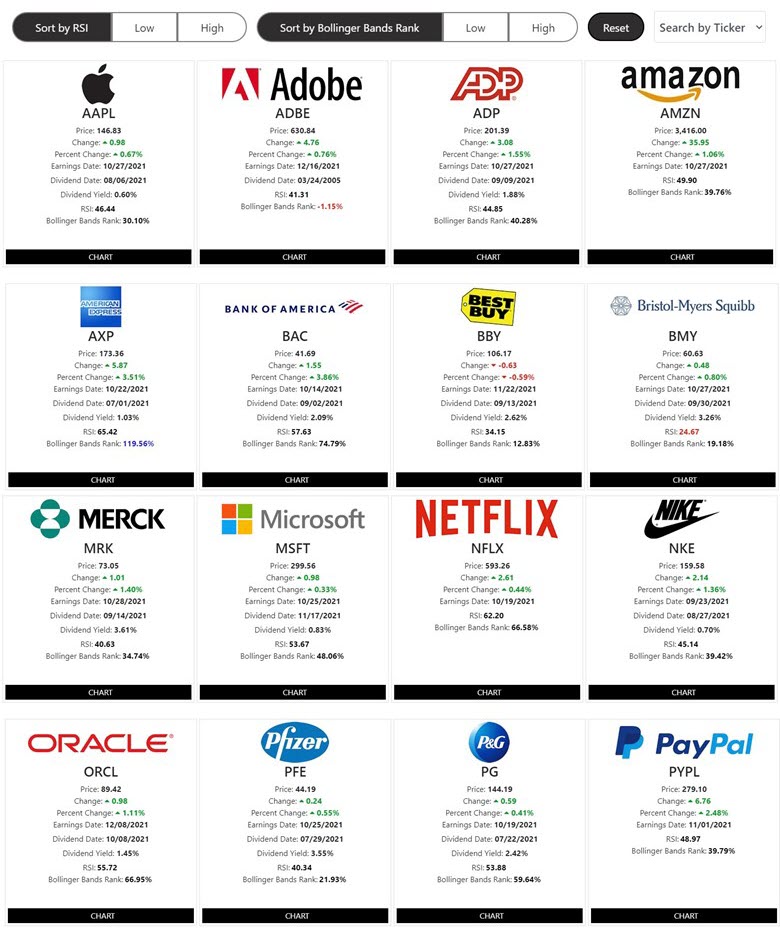
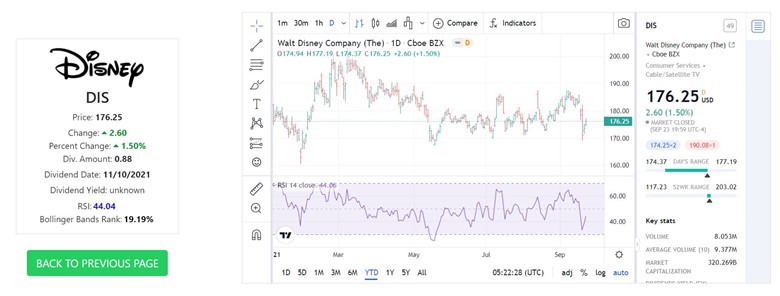
Using basic technical indicators and key dates can aid in trade type selection, such as covered calls, put spreads, call spreads, or iron condors (Figures 2 and 3).
Figure 2 – Options screening tool highlighting key technical indicators and dates to aide in selecting option trade types (covered calls, put spreads, call spreads or iron condors) - Options Screening Tool
Figure 3 – Options screening tool drilling down to ticker-specific interactive stock chart to compare historical data and a wide range of technical indicators to aid in selecting option trade types (covered calls, put spreads, call spreads, or iron condors)
Type Trade Selections
When selecting potential trades, focusing on highly liquid and well-established large-cap companies is key. The screening tool works off a database of 70 large-capitalization stocks and ETFs with ample sector diversity and liquidity in the options market.
One can quickly identify and filter by key technical indicators such as Relative Strength Index (RSI), Bollinger Band Rank, Dividend Date, and Earnings Date to aid in trade selection.
These key technical indicators can assist options traders with directional trade strategies such as covered calls, call spreads, put spreads, or neutral trade strategies such as iron condors.
Relative Strength Index (RSI): A momentum indicator that calculates the magnitude of a price change to assess overbought and oversold conditions in the price of an asset. RSI indicates whether or not a stock is in oversold (value below 30) or overbought (value over 70) conditions. These values can assist traders in directional trades such as put spreads and/or call spreads.
Bollinger Bands: A moving average of the underlying stock price enveloped by an upper and lower band. These bands are plotted at a 2 standard deviation level above and below the moving average of the stock price. Bollinger bands help determine whether prices are relatively high or low on a relative basis.
Bollinger Bands Rank: Where the current value ranks relative to the range between the lower and upper band. A high percentage indicates the price is relatively high, and a low percentage indicates that the price is relatively low. A value over 100% indicates the upper Bollinger band is broken, and a negative value indicates the lower Bollinger band is broken. These values can assist traders in directional trades such as put spreads and/or call spreads.
Earnings Date: A key volatility event that can have a significant influence on options premiums. These events can be used as earnings plays or avoided altogether when engaging in options trading.
Dividend Date: A key event to consider when selling covered calls as the owner of the shares will want to ensure that the dividend payout will be credited prior to any potential for the shares to be relinquished.
Collectively, these key technical indicators and dates can serve as a framework when executing directional trade and/or neutral trades.
10 Rules For An Agile Options Strategy
A disciplined approach to an agile options-based portfolio is essential to navigate pockets of volatility and circumvent market declines. A slew of protective measures should be deployed if options are used to drive portfolio results. When selling options and managing an options-based portfolio, the following guidelines are essential:
-
1. Trade across a wide array of uncorrelated tickers
2. Maximize sector diversity
3. Spread option contracts over various expiration dates
4. Sell options in high implied volatility environments
5. Manage winning trades
6. Use defined-risk trades
7. Maintains a ~50% cash level
8. Maximize the number of trades so the probabilities play out to the expected outcomes
9. Place probability of success in your favor (delta)
10. Appropriate position sizing/trade allocation
Conclusion
Controlling portfolio volatility to reduce systemic risk in relation to the broader market while generating similar or superior returns relative to the market is the goal of an options-based approach where cash is held in conjunction with long-term stock positions and an options component. A beta-controlled, options-based strategy is key, and the market meltdown in Q1 2022 reinforces why appropriate risk management is essential. An options-based approach provides a margin of safety while circumventing drastic market moves and containing portfolio volatility. In addition, an options-based portfolio can provide durability and resiliency during pockets of market turbulence.
To this end, when selecting potential trades, focusing on highly liquid and well-established large-cap companies is key. A screening tool can be leveraged with a database of 70 large-capitalization stocks and ETFs with ample sector diversity and liquidity in the options market. One can quickly identify and filter by key technical indicators such as Relative Strength Index (RSI), Bollinger Band Rank, Dividend Date, and Earnings Date to aid in trade selection. These key technical indicators can assist options traders with directional trade strategies such as covered calls, call spreads, put spreads, or neutral trade strategies such as iron condors.
Noah Kiedrowski
INO.com Contributor
Disclosure: Stock Options Dad LLC is a Registered Investment Adviser (RIA) firm specializing in options-based services and education. There are no business relationships with any companies mentioned in this article. This article reflects the opinions of the RIA. Any recommendation contained in this article is subject to change at any time. No recommendation is intended to constitute an entire portfolio. The author encourages all investors to conduct their own research and due diligence prior to investing or taking any actions in options trading. Please feel free to comment and provide feedback; the author values all responses. The author is the founder and Managing Member of Stock Options Dad LLC – A Registered Investment Adviser (RIA) firm www.stockoptionsdad.com defining risk, leveraging a minimal amount of capital, and maximizing return on investment. For more engaging, short-duration options-based content, visit Stock Options Dad LLC’s YouTube channel. Please direct all inquires to
in**@st*************.com
. The author holds shares of AAPL, ADBE, AMD, AMZN, ARKK, AXP, BA, BBY, C, CMG, CRM, DIA, DIS, FB, FDX, FXI, GOOGL, GS, HD, HON, INTC, IWM, JPM, MA, MS, MSFT, NKE, NVDA, PYPL, QQQ, SBUX, SPY, SQ, TMO, TWTR, UNH, V and WMT.


