The much-talked-about acquisition saga of Twitter, Inc. (TWTR) is finally drawing to a close.
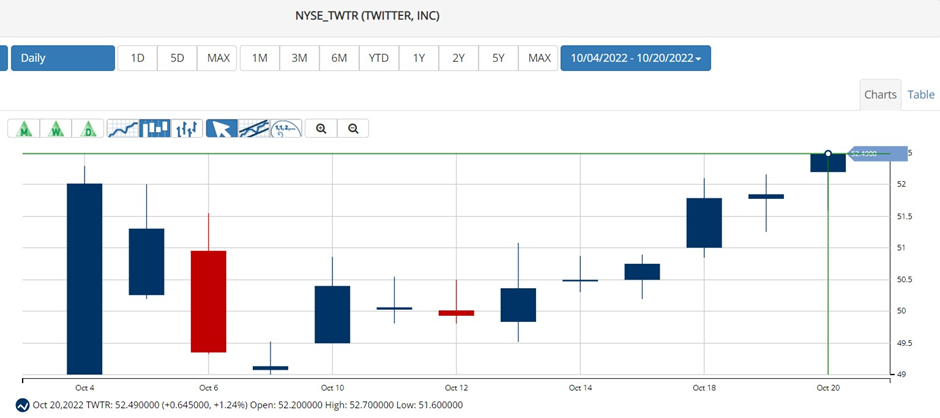
SpaceX founder Elon Musk finally agreed to buy the company for $54.20 a share. In a regulatory filing on October 4, Musk notified TWTR of his intent to go ahead with the initial agreed-upon deal to acquire the company and take it private. The stock jumped more than 22% on October 4, 2022, and has been on an uptrend since then.
There has been no shortage of controversy as the two parties were scheduled to go to trial on October 17. TWTR had dragged the Tesla CEO to court after he informed the company of his intention to terminate the agreement in July.
Musk had backed out of the deal, stating that TWTR had failed to disclose the number of bots and spam accounts on its platform. He claimed that the company was misleading investors by misstating the number of bots on its platform by providing false numbers in its corporate filings with the SEC.
On July 12, 2022, TWTR filed a lawsuit against Musk, as his decision to back out of the deal had led to its investor sentiment tumbling. In the lawsuit, TWTR argued that having signed a binding agreement, he could not abandon it.
Just after Musk officially tried to terminate the deal in July, hedge funds Pentwater Capital and Greenlight Capital sensed an opportunity. They went long on the stock as there was a signed contract, and Musk could only pull out of the deal if there were fraud in TWTR’s financial statements or any material event that could change the company’s value. So, in the absence of these issues, Musk had no option but to honor the contract.
Greenlight Capital founder David Einhorn said, “Investing in something like Twitter, which I think will resolve this year, is good because I should get the cash out to redeploy into the next thing.”
Matthew Halbower, Pentwater Capital’s founder, said, “In my 23-year career doing this, I’ve never seen an acquirer walk away without any reason.” “The probability of him being able to walk away was very low,” he added.
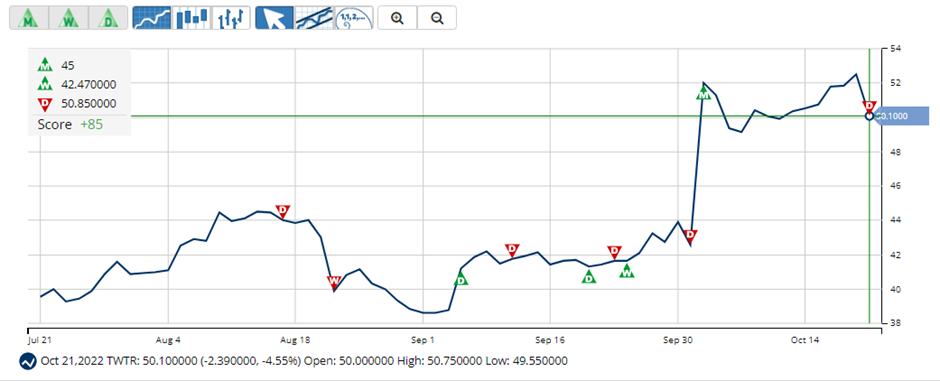
Shares of TWTR are currently trading above their 50-day and 200-day moving averages of $44.11 and $40.74, respectively, indicating an uptrend. The stock has gained 25.8% in price over the past month and 21.3% year-to-date to close the last trading session at $52.44.
Here’s what could influence TWTR’s performance in the upcoming months:
Weak Financials
TWTR’s revenue declined 1.1% year-over-year to $1.17 billion for the second quarter that ended June 30, 2022. The company’s non-GAAP net loss came in at $57.72 million, compared to a non-GAAP net income of $174.51 million a year ago.
Also, its non-GAAP loss per share came in at $0.08, compared to a non-GAAP EPS of $0.20. In addition, its adjusted EBITDA declined 67.5% year-over-year to $111.70 million.
Mixed Analyst Estimates
Analysts expect TWTR’s EPS for fiscal 2022 to increase 425.3% year-over-year to $1.05. Its EPS for fiscal 2023 is expected to decline 23.9% year-over-year to $0.80. Its revenues for fiscal 2022 and 2023 are expected to increase 4% and 15.2% year-over-year to $5.28 billion and $6.09 billion, respectively.
Mixed Profitability
Regarding the trailing-12-month gross profit margin, TWTR’s 60.84% is 20.4% higher than the 50.52% industry average. Likewise, its 16.62% trailing-12-month Capex/Sales is 294.3% higher than the industry average of 4.21%.
On the other hand, its 4.04% trailing-12-month EBITDA margin is 78.3% lower than the 18.63% industry average. In addition, its 0.50% trailing-12-month levered FCF margin is 93.8% lower than the 8% industry average.
Technical Indicators Show Promise
While TWTR may not look attractive from the fundamental point of view, it does show strong trends, which traders could capitalize on. According to MarketClub’s Trade Triangles, the long-term trend for TWTR has been UP since October 4, 2022, and its intermediate-term trend has been UP since September 26, 2022. However, the stock’s short-term trend has been DOWN since October 21, 2022.
The Trade Triangles are our proprietary indicators, comprised of weighted factors that include (but are not necessarily limited to) price change, percentage change, moving averages, and new highs/lows. The Trade Triangles point in the direction of short-term, intermediate-term, and long-term trends, looking for periods of alignment and, therefore, intense swings in price.
In terms of the Chart Analysis Score, another MarketClub proprietary tool, TWTR, scored +75 on a scale from -100 (strong downtrend) to +100 (strong uptrend), indicating Bull Market Weakness. While TWTR shows short-term weakness, it remains in the confines of a long-term uptrend.
The Chart Analysis Score measures trend strength and direction based on five different timing thresholds. This tool considers intraday price action; new daily, weekly, and monthly highs and lows; and moving averages.
Click here to see the latest Score and Signals for TWTR.
What's Next for Twitter, Inc. (TWTR)?
Remember, the markets move fast and things may quickly change for this stock. Our MarketClub members have access to entry and exit signals so they'll know when the trend starts to reverse.
Join MarketClub now to see the latest signals and scores, get alerts, and read member-exclusive analysis for over 350K stocks, futures, ETFs, forex pairs and mutual funds.
Best,
The MarketClub Team
su*****@in*.com


in other words. TWTR is being delisted on 08-NOV-2022, so not much point talking about it as a long-term anything.
um ... since Musk is taking TWTR private, that will remove it from the stock market. EH ??