With a slower increase in supplier and consumer prices signaling an easing of inflationary pressures, hopes of less aggressive interest rate hikes by the Federal Reserve are also rising.
While a broad economic recovery bodes well for the financial services sector, given rising borrowing costs and credit risks, traders should be judicious in picking stocks from this space.
Given its strong price trends, it could be wise to buy NerdWallet, Inc. (NRDS) to capitalize on the industry tailwinds. On the other hand, Ally Financial Inc. (ALLY) might be best avoided now, given its downtrend.
NerdWallet, Inc. (NRDS)
NRDS operates as a personal finance company. Through its platform, it delivers a range of financial products, including credit cards, mortgages, insurance, SMB products, personal loans, banking, investing, and student loans, to empower consumers and small and medium-sized businesses (SMBs) to make informed financial decisions at the right time.
For the fiscal 2022 third quarter, which ended September 30, 2022, NRDS’s revenue increased 45% year-over-year to $142.6 million, driven primarily by success across credit cards, banking, personal loans, and SMB verticals. During the same period, the company’s net income came in at $0.7 million or $0.01 per share, compared to a net loss of $7.8 million or $0.16 per share in the previous-year quarter.
Analysts expect NRDS to report revenue of $139.59 million for the fourth quarter of the current fiscal, ending December 2022, registering a 40.3% year-over-year increase. During the same period, the company’s EPS is expected to come in at $0.08, compared to a loss of $0.13 per share in the year-ago period.
Owing to its strong performance and solid growth prospects, NRDS is currently commanding a premium valuation compared to its peers. In terms of forward P/E, NRDS is currently trading at 67.53x compared to the industry average of 10.39x. Also, its forward EV/EBITDA multiple of 15.43 compares to the industry average of 12.28.
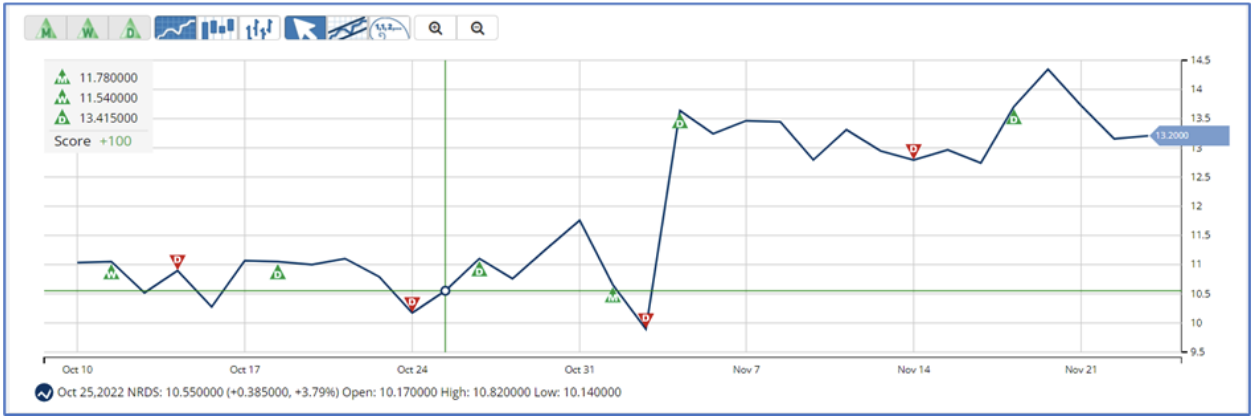
The stock is currently trading above its 50-day and 200-day moving averages of $11.24 and $10.64, respectively, indicating a bullish trend. It has gained 30.4% over the past month to close the last trading session at $13.13.
MarketClub’s Trade Triangles show that NRDS has been trending UP for all three-time horizons. Its long-term trend has been UP since November 1, 2022, while its intermediate-term trend has been UP since October 11, 2022. Its short-term trend has also been UP since November 17.
The Trade Triangles are our proprietary indicators, comprised of weighted factors that include (but are not necessarily limited to) price change, percentage change, moving averages, and new highs/lows. The Trade Triangles point in the direction of short-term, intermediate, and long-term trends, looking for periods of alignment and, therefore, strong swings in price.
In terms of the Chart Analysis Score, another MarketClub proprietary tool, NRDS scored +100 on a scale from -100 (strong downtrend) to +100 (strong uptrend), indicating a strong uptrend that is likely to continue. Traders should protect gains and look for a change in score to suggest a slowdown in momentum.
The Chart Analysis Score measures trend strength and direction based on five different timing thresholds. This tool takes into account intraday price action, new daily, weekly, and monthly highs and lows, and moving averages.
Click here to see the latest Score and Signals for NRDS.
Ally Financial Inc. (ALLY)
ALLY offers financial products and services digitally to commercial and corporate customers. The company operates through four segments: Automotive Finance; Insurance; Mortgage Finance; and Corporate Finance.
For the third quarter of fiscal 2022, ALLY’s adjusted total net revenue decreased 1% year-over-year to $2.09 billion. During the same period, the company’s core net income attributable to common shareholders decreased 55.8% year-over-year to $346 million. This translated to an adjusted quarterly EPS of $1.12, down 48.1% year-over-year.
Analysts expect ALLY’s EPS for fiscal 2022 to decrease 29.8% year-over-year to $6.05. Moreover, the company has missed the consensus EPS estimates in two of the trailing four quarters.
In terms of forward P/E, ALLY is currently trading at 4.34x compared to the industry average of 10.39x. Also, its forward Price/Sales multiple of 0.94 compares to the industry average of 2.90.
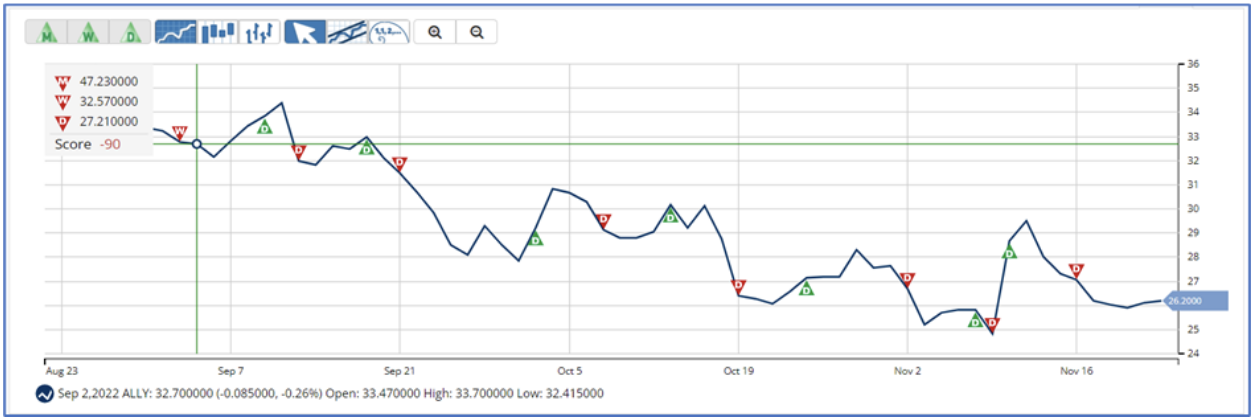
ALLY’s stock is currently trading below its 50-day and 200-day moving averages of $28.53 and $36.74, respectively, indicating a bearish trend. It has slumped 35% over the past six months and 46% year-to-date to close the last trading session at $26.24.
MarketClub’s Trade Triangles show that ALLY has been trending DOWN for all three-time horizons. The long-term trend for ALLY has been DOWN since November 19, 2021. Its intermediate and short-term trends have been DOWN since September 1, 2022, and November 16, 2022, respectively.
In terms of the Chart Analysis Score, ALLY scored -90 on a scale from -100 (strong downtrend) to +100 (strong uptrend), indicating that it is in a strong downtrend that is likely to continue. While ALLY is showing intraday strength, it remains in the confines of a bearish trend. Traders should use caution and set stops.
Click here to see the latest Score and Signals for ALLY.
What's Next for These Financial Stocks?
Remember, the markets move fast and things may quickly change for these stocks. Our MarketClub members have access to entry and exit signals so they'll know when the trend starts to reverse.
Join MarketClub now to see the latest signals and scores, get alerts, and read member-exclusive analysis for over 350K stocks, futures, ETFs, forex pairs and mutual funds.
Best,
The MarketClub Team
su*****@in*.com


