
Leading restaurant chain operator BJ’s Restaurants, Inc. (BJRI) operates more than 213 restaurants in 29 states.
The company’s impressive third-quarter sales reflect the progress of its sales-building initiatives and its guests’ strong affinity for the brand.
BJRI’s comparable restaurant sales increased by 8.9% and 8.2% compared to the third quarters of 2021 and 2019, respectively. While restaurant-level operating margins were impacted by inflationary pressures, they benefited from labor management efficiencies and early successes of its margin improvement initiative.
“Our sales performance has continued into October with period-to-date comparable restaurant sales increasing approximately 8% and 6% compared to the same periods in 2021 and 2019, respectively,” said Greg Levin, BJRI’s CEO and President.
Moreover, BJRI’s operating stability, sales building, and margin improvement positioned it to opportunistically return capital to shareholders through share repurchases in the third quarter. During the third quarter, BJRI repurchased and retired nearly 91,000 shares of its common stock for approximately $2.4 million. The company has $22.1 million available under its currently authorized share repurchase program.
Furthermore, BJRI’s long-term target remains to operate at least 425 domestic locations. The company recently announced opening its restaurant in North Las Vegas, Nevada. This restaurant is BJRI’s fifth restaurant in the Las Vegas area and its seventh restaurant in the state of Nevada.
“We are on track to open our sixth and last restaurant of the year next month in Phoenix, Arizona,” said Greg Levin. Additionally, BJRI’s restaurant model initiative continues to deliver strong sales growth and financial returns by adding seating capacity and enhancing its bar statement. The company plans to increase its remodel initiative to more restaurants in 2023.
Shares of BJRI have gained 39.9% over the past six months. The stock is currently trading above its 50-day and 200-day moving averages of $28.25 and $26.71, respectively.
Here is what could influence BJRI’s performance in the upcoming months:
Mixed Financials
For the fiscal 2022 third quarter ended September 27, 2022, BJRI’s revenues increased 10.3% year-over-year to $311.35 million. Its comparable restaurant sales increased by 8.9%, while its total restaurant operating weeks grew by 1.2% compared to the third quarter of 2021.
However, the company’s loss from operations came in at $5.17 million for the quarter. It reported a net loss of $1.64 million and $0.07 per share, respectively.
Favorable Analyst Estimates
Analysts expect BJRI’s revenue for the fiscal 2022 fourth quarter (ending December 2022) to come in at $344.84 million, indicating an increase of 18.4% from the prior-year period. The consensus EPS estimate of $0.06 for the ongoing quarter indicates a 130% year-over-year increase.
Furthermore, analysts expect BJRI’s revenue and EPS for the current fiscal year 2022 to increase by 18.2% and 120.8% from the previous year to $1.28 billion and $0.05, respectively. In addition, the company’s revenue and EPS for the next year are expected to rise 4.1% and 1,480% year-over-year to $1.34 billion and $0.05, respectively.
Mixed Valuation
In terms of forward non-GAAP P/E, BJRI is currently trading at 846.07x, significantly higher than the industry average of 12.56x. The stock’s forward EV/EBITDA multiple of 18.45 is 99.9% higher than the industry average of 9.23.
However, the stock’s forward EV/Sales of 0.98x is 9.6% lower than the industry average of 1.08x. Its forward Price/Sales of 0.57x is 32.9% lower than the industry average of 0.86x. Also, its forward Price/Book multiple of 2.15 compares with the industry average of 2.58.
Technical Indicators Show Promise
In addition to looking attractive from the fundamental point of view, BJRI shows strong trends, which make it a solid stock to buy now.
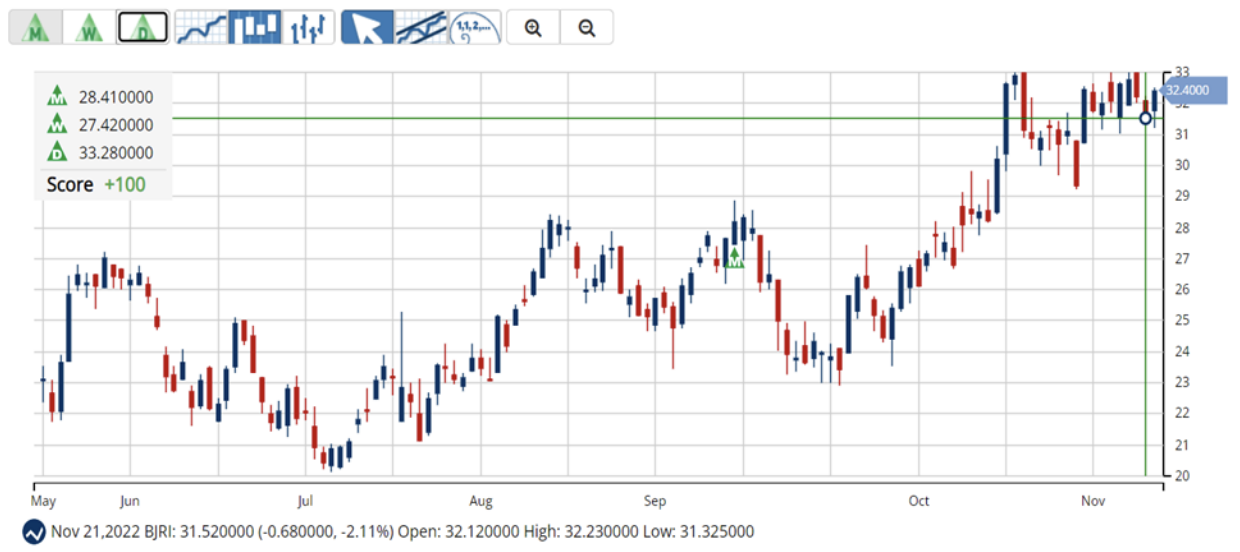
According to MarketClub’s Trade Triangles, BJRI has been trending UP for two of the three time horizons. The long-term trend for BJRI has been UP since September 15, 2022, and its intermediate-term trend has been UP since October 18, 2022. However, its short-term trend has been DOWN since November 22, 2022.
The Trade Triangles are our proprietary indicators, comprised of weighted factors that include (but are not necessarily limited to) price change, percentage change, moving averages, and new highs/lows. The Trade Triangles point in the direction of short-term, intermediate, and long-term trends, looking for periods of alignment and, therefore, intense swings in price.
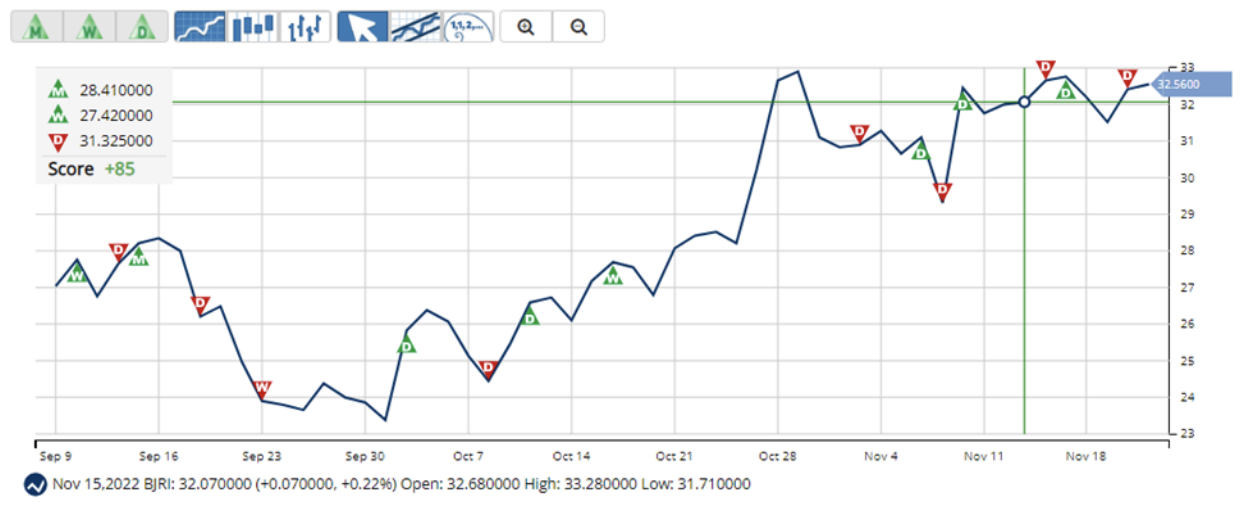
In terms of the Chart Analysis Score, another MarketClub proprietary tool, BJRI, scored +85 on a scale from -100 (strong downtrend) to +100 (strong uptrend), indicating short-term weakness. However, traders could reasonably look for the longer-term bullish trend to resume.

The Chart Analysis Score measures trend strength and direction based on five different timing thresholds. This tool considers intraday price action; new daily, weekly, and monthly highs and lows; and moving averages.
Click here to see the latest Score and Signals for BJRI.
What's Next for BJ’s Restaurants, Inc. (BJRI)?
Remember, the markets move fast and things may quickly change for this stock. Our MarketClub members have access to entry and exit signals so they'll know when the trend starts to reverse.
Join MarketClub now to see the latest signals and scores, get alerts, and read member-exclusive analysis for over 350K stocks, futures, ETFs, forex pairs and mutual funds.
Best,
The MarketClub Team
su*****@in*.com