
The global economic recovery may be in potential jeopardy with China caught in an unenviable dilemma between strong politics and good economics with respect to covid lockdowns.
In the world’s second-largest economy and a nation not used to dealing with widespread dissent, economic hardship may seamlessly turn into political instability, thereby risking yet another disruption in the global supply chain. Markets have also reflected the nervousness with a decline in stock futures and Brent crude at the lowest level since January.
Amid such uncertainty, consumption-driven businesses that enjoy inelastic demand and resilient margins for the essential products and services they offer can act as ideal ballast for the choppy waters we can’t find a way out of.
Hence, it could be wise to add Johnson & Johnson (JNJ), PepsiCo, Inc. (PEP), and Archer-Daniels-Midland Company (ADM) as some technical indicators point to sustained upsides with adequate downside protection.
Johnson & Johnson (JNJ)
JNJ is a worldwide researcher, developer, manufacturer, and seller of various healthcare products. The company operates through three segments: Consumer Health; Pharmaceuticals; and MedTech.
Over the last three years, JNJ’s revenues have grown at a 5.5% CAGR, while its EBITDA has grown at 4.6%. During the same period, the company’s net income has grown at 10.6% CAGR.
JNJ’s sales increased 1.9% year-over-year to $23.79 billion in the fiscal 2022 third quarter ended October 2, 2022. The company’s gross profit stood at $15.98 billion during the same period.
Analysts expect JNJ’s revenue for the fiscal year 2022 to increase by 1.4% year-over-year to $95.04 billion. The company’s EPS for the current year is expected to increase 2.5% year-over-year to $10.04. Moreover, JNJ has topped the consensus EPS estimates in each of the trailing four quarters.
In terms of forward P/E, JNJ is currently trading at 17.64x compared to the industry average of 19.70x. Also, its forward EV/EBITDA multiple of 14.04 compares to the industry average of 13.29.
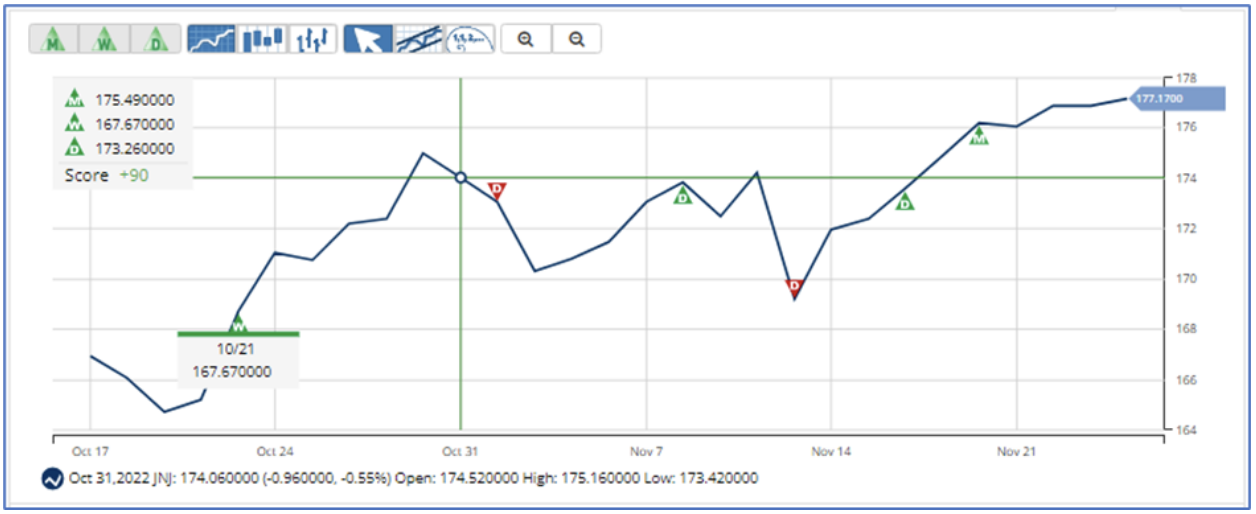
JNJ’s stock is currently trading above its 50-day and 200-day moving averages of $168.84 and $172.29, respectively, indicating a bullish trend. It has gained 4.1% over the past month and 11.3% over the past year to close the last trading session at $177.24.
MarketClub’s Trade Triangles show that JNJ has been trending UP for all three-time horizons. Its long-term trend has been UP since November 18, 2022, while its intermediate-term trend has been UP since October 21, 2022. Its short-term trend has also been UP since November 16.
The Trade Triangles are our proprietary indicators, comprised of weighted factors that include (but are not necessarily limited to) price change, percentage change, moving averages, and new highs/lows. The Trade Triangles point in the direction of short-term, intermediate, and long-term trends, looking for periods of alignment and, therefore, strong swings in price.
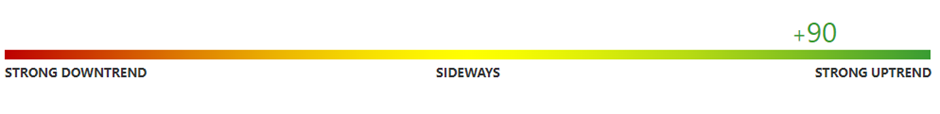
In terms of the Chart Analysis Score, another MarketClub proprietary tool, JNJ scored +90 on a scale from -100 (strong downtrend) to +100 (strong uptrend), indicating that the stock is in a strong uptrend that is likely to continue. Traders should use caution and utilize a stop order.
The Chart Analysis Score measures trend strength and direction based on five different timing thresholds. This tool takes into account intraday price action, new daily, weekly, and monthly highs and lows, and moving averages.
Click here to see the latest Score and Signals for JNJ.
PepsiCo, Inc. (PEP)
PEP is a global manufacturer, marketer, distributor, and seller of beverages and convenience foods. The company operates through seven segments: Frito-Lay North America; Quaker Foods North America; PepsiCo Beverages North America; Latin America; Europe; Africa, Middle East, and South Asia; Asia Pacific, Australia and New Zealand and China Region.
Over the last three years, PEP’s revenues have grown at an 8.2% CAGR, while its EBITDA has grown at 5.3% CAGR. During the same period, the company’s net assets have grown at 6.9% CAGR.
For the third quarter of the fiscal year 2022 ended September 3, 2022, PEP’s net revenue increased 8.8% year-over-year to $21.97 billion. The company’s operating profit increased 6.1% year-over-year to $3.53 billion, while the net income attributable to PEP increased 21.5% year-over-year to $2.70 billion, up 21.9% year-over-year.
Analysts expect PEP’s revenue for the current fiscal year to increase 6.8% year-over-year to $84.87 billion. During the same period, the company’s EPS is estimated to grow 8.4% year-over-year to $6.78. Moreover, it has also impressed by surpassing consensus EPS estimates in each of the trailing four quarters.
Due to its solid growth prospects, in terms of forward P/E, PEP is currently trading at 27.14x compared to the industry average of 19.34x. Also, its forward EV/EBITDA multiple of 19.21 compares to the industry average of 12.08.
PEP’s stock is currently trading above its 50-day and 200-day moving averages of $173.90 and $170.25, respectively. It has gained 3.3% over the past month and 6.4% year-to-date to close the last trading session at $184.11.
MarketClub’s Trade Triangles show that PEP has been trending UP for all three-time horizons. The long-term trend for PEP has been UP since October 28, 2022. Its intermediate and short-term trends have been UP since October 13 and November 17, respectively.
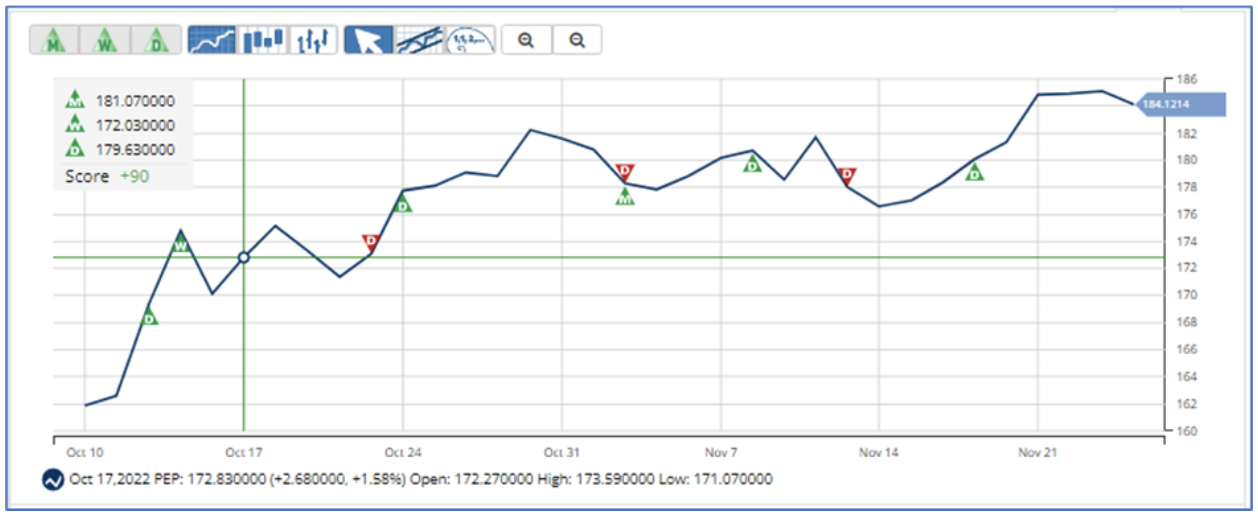
In terms of the Chart Analysis Score, PEP scored +90 on a scale from -100 (strong downtrend) to +100 (strong uptrend), indicating that it is in a strong uptrend that is likely to continue. Traders should use caution and utilize a stop order.
Click here to see the latest Score and Signals for PEP.
Archer-Daniels-Midland Company (ADM)
ADM operates as an agricultural origination and processing company that offers sustainable human and animal nutrition. The company operates through three segments: Ag Services and Oilseeds, Carbohydrate Solutions, and Nutrition.
Over the last three years, ADM’s revenue has grown at a 15.4% CAGR, while its EBITDA has grown at a 27.9% CAGR. During the same period, the company’s net income has grown at 51.1% CAGR.
For the third quarter ended September 30, 2022, ADM’s revenues increased 21.4% year-over-year to $24.68 billion due to robust global demand. The company’s gross profit increased 36.6% year-over-year to $1.81 billion during the same period.
ADM’s quarterly adjusted net earnings increased 91.2% year-over-year to $1.05 billion. This translated to an adjusted EPS of $1.86, up 91.8% year-over-year.
Analysts expect ADM’s revenue and EPS for the fiscal ending December 2022 to increase 18.5% and 45.2% year-over-year to $101.04 billion and $7.53, respectively. Moreover, the company has impressed by surpassing consensus EPS estimates in each of the trailing four quarters.
Despite its impressive prospects, ADM is trading at a discount compared to its peers signaling further upside potential. In terms of the forward P/E, the stock is currently trading at 12.93x, compared to the industry average of 19.34x. Also, its forward EV/EBITDA multiple of 9.46 compares to the industry average of 12.08.
Despite its attractive valuation, ADM’s stock is trading above its 50-day and 200-day moving averages of $89.90 and $85.74, respectively, indicating a bullish trend. The stock has gained 8.1% over the past month and 43.5% year-to-date to close the last trading session at $97.40.
MarketClub’s Trade Triangles show that ADM has been trending UP for all three-time horizons. The long-term trend for ADM has been UP since September 9, 2022. Its intermediate and short-term trends have been UP since October 13 and November 21, 2022, respectively.
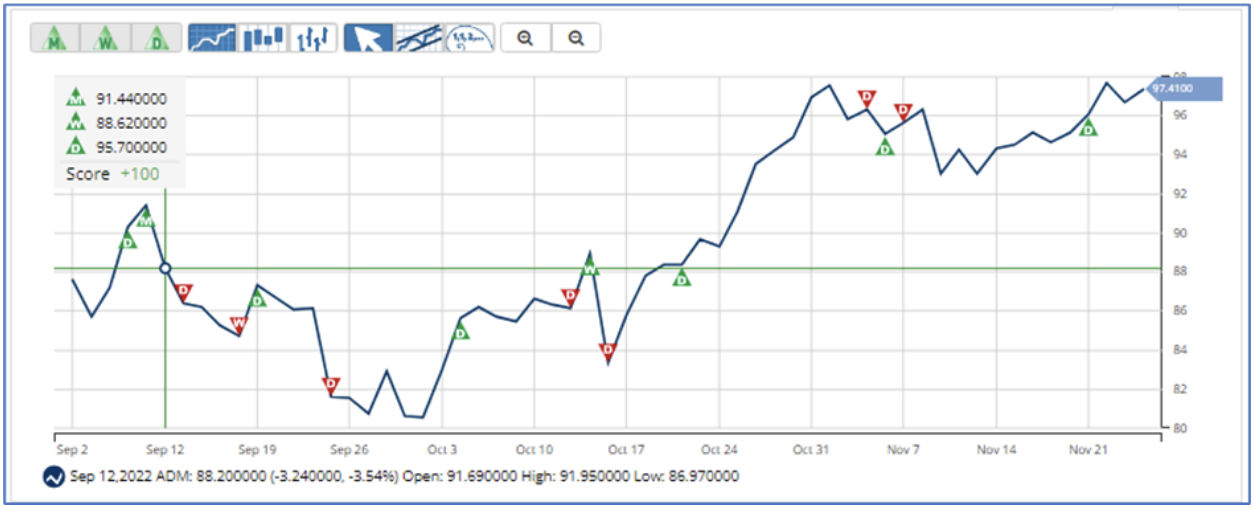
In terms of the Chart Analysis Score, ADM scored +100 on a scale from -100 (strong downtrend) to +100 (strong uptrend), indicating that the uptrend is likely to continue. ADM continues to climb with short-term, intermediate, and long-term bullish momentum. Traders should protect gains and look for a change in score to suggest a slowdown in momentum.

Click here to see the latest Score and Signals for ADM.
What's Next for These Stocks?
Remember, the markets move fast and things may quickly change for these stocks. Our MarketClub members have access to entry and exit signals so they'll know when the trend starts to reverse.
Join MarketClub now to see the latest signals and scores, get alerts, and read member-exclusive analysis for over 350K stocks, futures, ETFs, forex pairs and mutual funds.
Best,
The MarketClub Team
[email protected]
ADM has gone down for last full week. You are incorrect. I own it and follow it daily.