Previously, I authored a piece covering options trading and the mechanics behind long-term successful options trading to generate high probability win rates for consistent premium income. I provided empirical data via 100 options trades during the market wide sell-off in Q4 of 2018 where the Dow and S&P 500 erased all of its gains while turning negative for the year and posting their worse December since the Great Depression in 1931. Despite this negative backdrop, I was able to successfully close 80% of my trades at a profit, demonstrating the resiliency of high probability options trading regardless of market condition. These trading mechanics resulted in a total portfolio return of -5.9% against the S&P 500 return of -14.0% in Q4 of 2018, outperforming the broader index by a wide margin.
Since then, the month of January presented the polar opposite market scenario with the S&P closing out the best January in over 30 years. Maintaining the same trading mechanics deployed in Q4 of 2018 into January produced a portfolio return of 9.26% against the S&P 500 return of 7.87%, outperforming the index by a healthy margin. This seesaw from a negative to a positive market backdrop provided unique opportunities to capitalize on option trading via capturing a higher percentage of premium income, closing contracts early in the option lifecycle and relinquishing previously assigned contracts, which allowed the repurposing of capital for further options trading. In January, I was able to achieve a 100% options win rate by closing 30 out of 30 option contracts while maintaining capital liquidity.
Terse Overview
Options trading can be a fantastic avenue to mitigate risk; provide consistent income, lower cost basis of underlying stock positions and hedge against market movements while maintaining liquidity. Risk mitigation is particularly important given the market wide melt-down during Q4 of 2018. Maintaining liquidity via maintaining cash on hand to engage in covered put option selling is a great way to collect monthly income via premium selling. Heeding critical variables such as implied volatility, implied volatility percentile and probability, one can optimize option selling to yield a high probability win rate over the long term given enough trade occurrences. I demonstrated via empirical data how these critical elements translate from predictive high probability outcomes to reality. In the end, options are a bet on where the stock won’t go, not where it will go and collecting premium income throughout the process. These empirical data demonstrate that the probabilities play out given enough occurrences over time. Despite a small sample size (131 trades) in a period where the market seesawed from erasing all of its gains for 2018 to posting its best January in 30 years, an 85% win rate was achieved while outperforming the broader market by a spread of 10% from October of 2018 through January of 2019 (S&P -7.2% vs. 2.8%).
Trading Mechanics
1) Sell option contracts 1 standard deviation out-of-the-money to theoretically yield an 84% probability of closing the trade at a profit at expiration
2) Selling in underlying securities that possess high implied volatility and high implied volatility percentile (greater than ~60th percentile)
3) The vast majority of contracts are sold ~30 days out in duration
4) I execute a buy-to-close order on all my positions at a ~50% or greater profit to realize my gains and accelerate the closure of the contract to free up capital for additional positions
5) If a contract is assigned, then I will hold onto the shares until the position rebounds until I can relinquish these shares at a profit
6) I may sell covered calls to mitigate losses on assigned positions
7) I trade a wide variety of tickers in both stocks and ETFs across all sectors while being agnostic to any particular sector or underlying security
8) Position sizing typically ranges from 3%-6% of the portfolio for each trade, and I elect any dividends from assigned contracts to be paid out in cash
9) All data accounts for commissions/fees; thus all numbers are final net values after backing out trading fees.
Leveraging Volatility and Empirical Results
The main keys are to maximize the option seller’s edge via exploiting volatility (high IV percentile) and time premium decay. Stocks can temporarily become highly volatile with the expectation that this volatility will decrease in these high IV percentile situations. Rich premiums are paid out to option sellers with the expectation that volatility will revert to its mean, allowing the option to decrease in value and expire worthless at expiration even if the underlying stock moves sideways or down without breaking through the strike price in a high probability manner. The high IV percentile provides rich premium via time value and as the option lifecycle unfolds and this volatility decreases the option time value implodes, and the option decreases in value allowing profits to be released earlier in the lifecycle without waiting until the expiration of the contract.
The outcomes are as follows; If the shares move in your favor (in this case the shares appreciate in value or trade sideways) the put seller has optionality where he can buy-to-close the contract at a profit or allow the option to expire worthless. Time decay is on your side through the contract lifespan so every day that passes, the option seller will gain value due to time premium evaporating. If the shares trade positive, sideways or decrease (without breaking through the strike price), then option gains are in the seller’s favor.
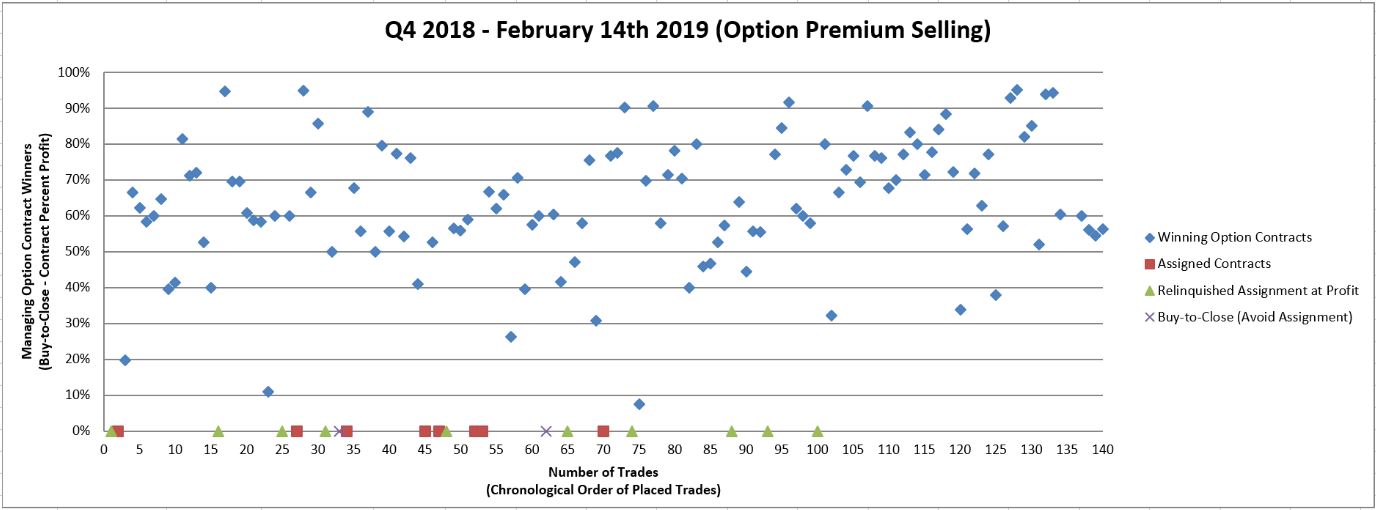
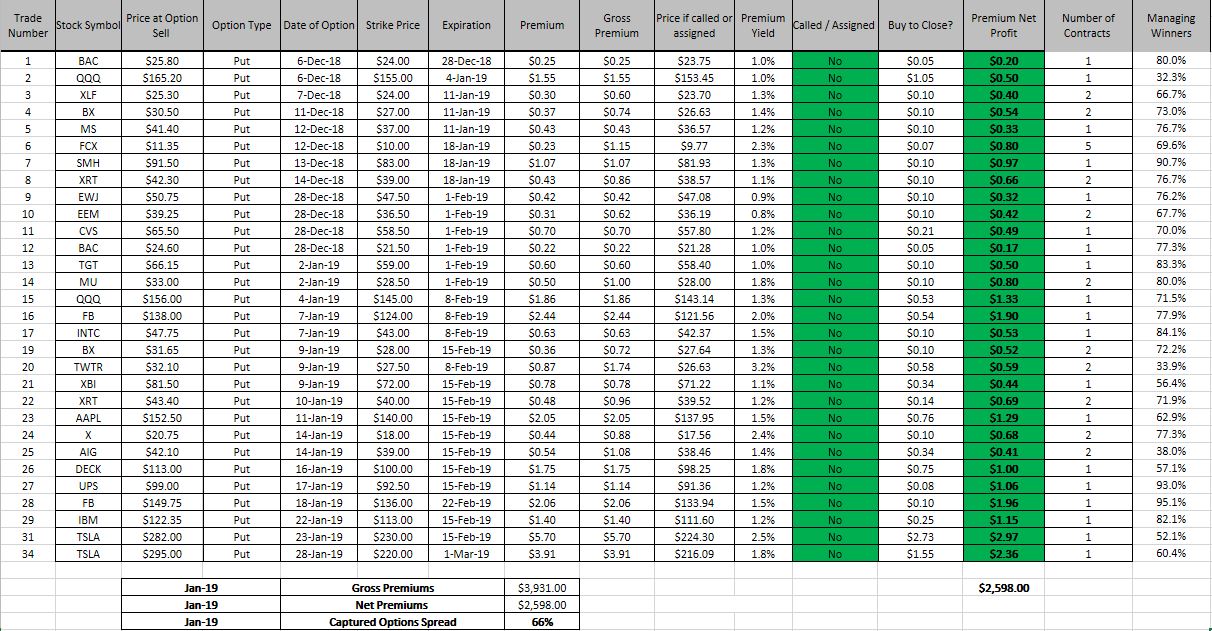
A wide array of options in different sectors with different expiration dates will ensure portfolio diversity and plenty of opportunities to take profits and repurpose those funds. These empirical data demonstrate that the probabilities play out given enough occurrences over time. Despite a small sample size (131 trades) in a period where the market erased all of its gains for the year and then seesawed back into positive territory in January, an 85% win rate was achieved while outperforming the broader market by a wide margin. Accounting for all the contract income, assigned underlying positions that were relinquished at a profit and unrealized losses (total portfolio) yielded a return of 2.8% while the broader S&P 500 posted a return of -7.2% (Q4 through Jan 2019). The mechanics behind all these trades is an iterative process as described above and in the figures below (Figures 1 and 2 and Tables 1 and 2).

Figure 1 – Graph displaying all 131 trades with the outcome of each trade and profit realized (e.g., if an option is sold for a net premium of $100 and then managed for a buy-to-close for a net of $10 then a 90% net realized gain is logged)

Figure 2 – Details for options trades that were executed in January

Table 1 – Summary of Q4 2018 and the month of January options trading

Table 2 – Summary of January options trades and net results for the month
January Strength and Options Data
Out of the 131 trades (largely comprised of selling puts) 111 trades were closed at a profit, and 20 were assigned/forced relinquished thus non-profitable. Out of these 20 losses, 9 assignments were inevitably sold at a profit and 2 were buy-to-close for a minor loss to avoid assignment or avoid relinquishment. Net losses were 11 and using the format the following results were generated. General Electric (GE) (2 trades for a total of 9 contracts), United States Oil (USO) (2 trades for a total of 8 contracts) ETF, Schlumberger (SLB) (1 contract), Bank of America (BAC) (1 contract), American Airlines (AAL) (2 contracts) and Capri Holdings (CPRI) (1 contract). In total, $14,603 of premium income was received over these 131 trades, and after all buy-to-close managing of the trades, $8,558.60 was netted, equating to a 55.8% premium capture. This translates into the ~50% premium capture that I target as a goal while accounting for all commissions and non-profitable trades. Despite the assignments and option losses, the portfolio easily outperformed the S&P 500 over the four months from October of 2018 through January of 2019 (S&P -7.2% vs. 2.8%).
The stock market strength witnessed in January is a great opportunity to revisit assigned positions that previously moved against the probabilities. In my case, I was assigned several underlying securities in Transocean (RIG), eBay (EBAY), Micron (MU), Biotech ETF (XBI) and Mexico ETF (EWW) in the market sell-off during Q4 of 2018. As the January strength lifted all of these assignments, I was able to sell these assignments at profits (sale price > assignment price) and capitalize on the market conditions provided. This market strength allowed these positions to be profitable and thus the ability to repurpose the capital for continued options trading.
Importance of Position Sizing
Position sizing is critical to successful options trading as one, or a few bad assignments may erase all gains that were collected over tens of trades, effectively negating all the successes. This is particularly true during periods of sudden bear markets like the one in Q4 of 2018. This is true with sector sell-offs as well like the secular decline in the financials largely due to the Federal Reserve stance on interest rate hikes and gas and oil-related stocks. General Electric (GE), United States Oil (USO) ETF, Schlumberger (SLB), Bank of America (BAC) and Capri Holdings (CPRI) were all assigned to me and resulted in significant unrealized losses as these underlying positions broke through the 1 standard deviation threshold and continued to free fall. Some positions that were assigned at expiration were ultimately sold at a gain once the underlying position broke through the assigned price on the rebound (i.e., PYPL, WYNN, RIG, eBay, TWTR, MU, XBI, EWW, and FCX).
Conclusion
Sticking to the mechanics of selling options with high implied volatility, high IV percentile, 1 standard deviation out-of-the-money for an ~85% probability of success and great liquidity provides rich option premium selling. As volatility decreases, the option contract will decrease in value providing the option seller with the potential for realized gains. Taken together, this translates into high probability options trading to maximize option outcomes regardless of directionality and market backdrop. Despite the Dow and S&P 500 posting their worse December since the Great Depression in 1931 and then posting its best January in over 30 years, my portfolio over this timeframe outperformed the S&P 500 by a wide margin (2.8% versus -7.2%). This seesaw of a market provided a true test to the high probability trading and durability of this options trading method and yielded an 85% success rate. These empirical data demonstrate that the probabilities play out given enough occurrences over time with varying market backdrops. Despite a small sample size (131 trades), the method has outperformed the broader market by a wide margin in both market conditions.
Thanks for reading,
The INO.com Team
Disclosure: The author holds shares The author holds shares of GE, USO, CPRI, BAC, SLB, and AAL. The author has no business relationship with any companies mentioned in this article. This article is not intended to be a recommendation to buy or sell any stock or ETF mentioned.

Dear Noah
Thank you for this clear concise method of selling options. Most do not give this detail.
Jerry
Hi Jerry
Thanks for the positive feedback, I'll continue to provide a high level of detail for all my option trades. My goal is to continue to update readers through all market conditions on this options strategy while sticking to the mechanics outlined above. I'm aiming for a larger sample size to enhance the statistical power of these data. As of right now I've logged about 150 trades so stay tuned and feel free to visit my website http://www.stockoptionsdad.com
Awesome rundown, great work! Were these all “naked” puts? Still new to options, do you have to buy the put first? In order to sell it?