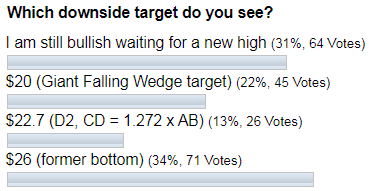
Last time I updated on the crude oil futures in May 2019, I asked if “You Were Waiting for Crude Oil at $20”. Both the weekly chart and the monthly chart had a bearish outlook as the price of crude topped at $66.60 and then it plummeted below $60. The targets were set between $32 and $22. Check out the poll results below.

Most of you voted that the price would tag the former bottom of $26. As we know now, the price indeed dropped heavily, but it couldn’t break below $50 and bounced back up from there. So the majority result was the closest call, although with a considerable difference.
The chart structure had changed since then and I am happy to share with you the emerging buy setup for crude oil futures with a considerable reward opportunity. Let’s start with an updated weekly chart below to see the idea.

Chart courtesy of tradingview.com
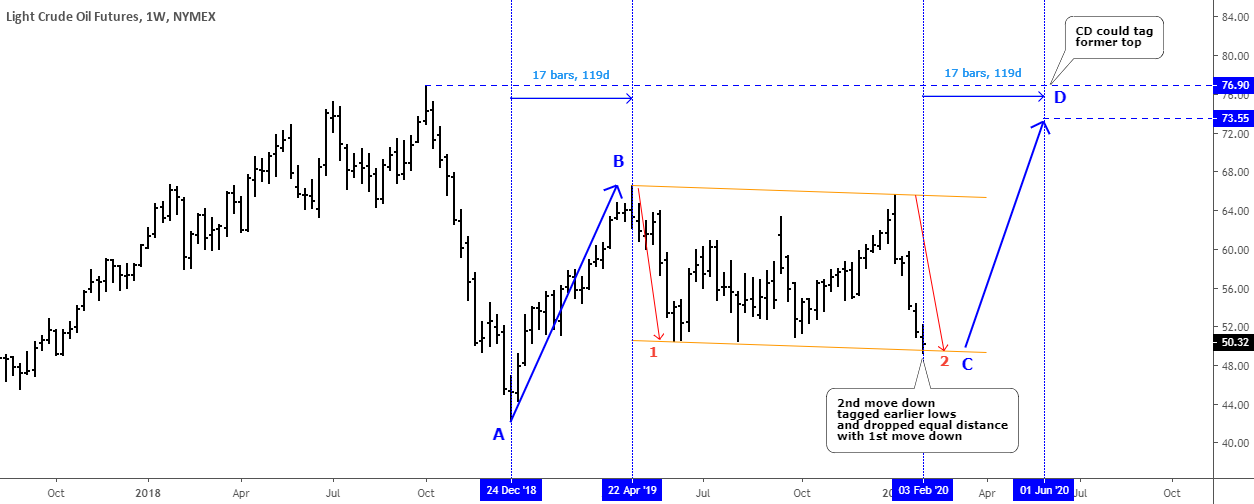
We can see in the weekly chart above that the crude oil futures spent almost one year within a $50-67 range. The whole zigzag fitted nicely within an almost flat orange channel. It consists of two drops highlighted with two red down arrows. The second drop recently tagged earlier lows at the $50 level and reached the same distance as the first move to the downside. This created an almost perfectly flat range.
This corrective structure retraced more than 61.8% of the preceding move up marked as blue AB segment. All minimum targets were reached within the flat orange correction and I think the new valley at $49.31 could be considered as a bottom.
The AB segment distance is equal to $24.24 and 17 weekly bars. Then the target for the second move up within a blue CD segment equal to the AB segment could be set at $73.55 at the start of June 2020. The bullish move could extend itself and tag the former top of $76.90 (October 2018).
It was a general idea and now let’s get down to the trade setup on a 4-hour time frame.

Chart courtesy of tradingview.com
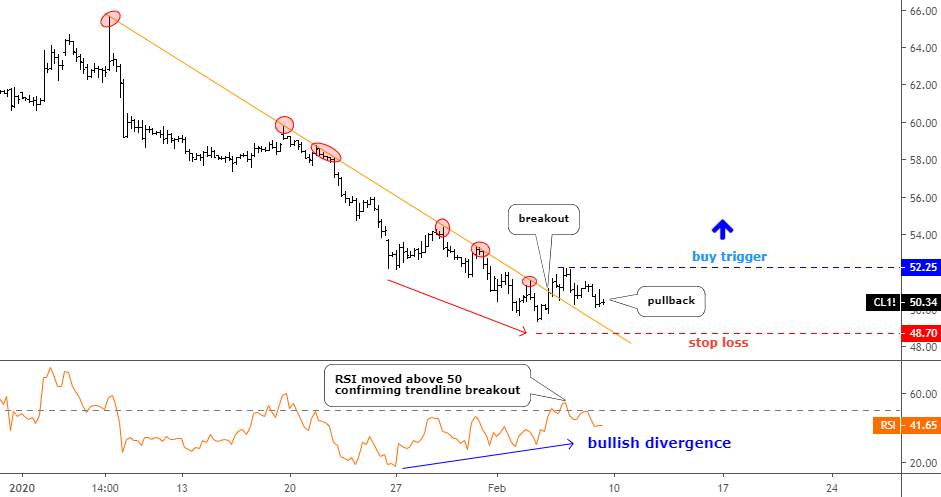
To build the trade setup, I switched to a 4-hour time frame to focus on the whole second move down. The orange trendline resistance kept the price beneath it until last Wednesday when it broke above it. The RSI shows that it wasn’t an accident as we can see how the Bullish Divergence had been built before the breakout as lower price valleys (red down arrow) contradicted with higher bottoms (blue up arrow) on the indicator chart.
The price breached the orange trendline as the RSI moved above the 50 level simultaneously. The breakout has been followed by a classic pullback, which already reached 61.8% Fibonacci retracement level.
The buy setup is based on the breakup of the recent top established during the recent breakout of the orange trendline resistance above $52.25. The stop should be set below the recent bottom; currently, it is in the $48.70 area. If the price updates the former minimum of $49.31 before triggering $52.25, then use this new low to limit the risk below it. The target is set at $73.55 on the weekly chart above. The risk/reward ratio stands at 1:6 with the above-mentioned entry/exit, which is huge. And we should consider the extended target of $76.90 as a potential extra gain.
Intelligent trades!
Aibek Burabayev
INO.com Contributor, Metals
Disclosure: This contributor has no positions in any stocks mentioned in this article. This article is the opinion of the contributor themselves. The above is a matter of opinion provided for general information purposes only and is not intended as investment advice. This contributor is not receiving compensation (other than from INO.com) for their opinion.

Correct, nobody knows the future.
If all if the assumptions and prepositions become true.....
I will trade instead if speculate.
It could have been a possibility had there been no corona virus threat and crises in India .China and India are major consumers of oil and there is likely hood of demand collapse. I expect oil to drop around 30$ by June this ear.
Dear Shahid,
Thank you for sharing your opinion.
Let’s live and see as nobody knows the future.
Best wishes, Aibek
Looks like a compelling setup. What symbol do we trade ? I see WTI at $#.36 and WTI Offshore at the ranges you show .
Thanks
Ken
Dear Mr.Gibson,
The crude oil futures code on NYMEX is CL. https://www.cmegroup.com/trading/energy/crude-oil/light-sweet-crude_contract_specifications.html
Best wishes, Aibek