Bitcoin celebrated its 13th-anniversary last month. Which place in the financial universe does this "teenager" take over the time? Naturally, the judgment on this constantly changes with the growing acknowledgment of Bitcoin. It started as a revolutionary experiment, and nowadays, it is considered a financial asset with a growing acceptance from investors reflected in the market cap of over $700 billion.
Earlier, Bitcoin was called a "digital gold," which came to replace the ancient store of value. However, it better suits the lifestyle of the modern generation, as it is easier to handle and store compared to gold; moreover, it is digitally trendy.
After that, some analysts considered it as an inflation hedge as the emission of Bitcoin is limited with twenty-one million coins while fiat is not. The ninety percent of maximum supply has already been mined.
Recently, it's been acknowledged as the gauge of the stock market as they collapsed simultaneously.
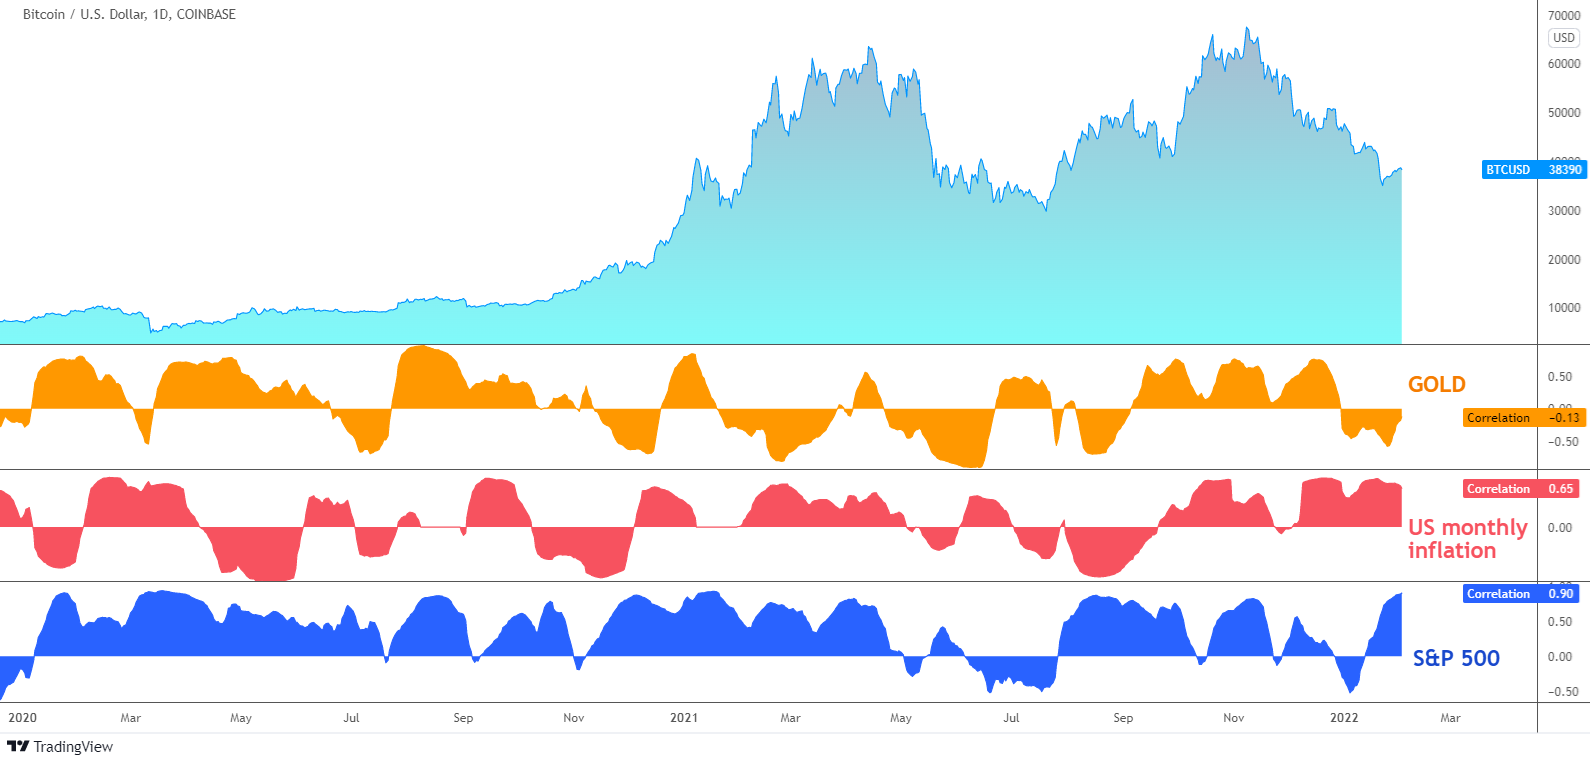
Let's check on the daily chart below to determine which nickname suits Bitcoin best.
Three 40-day correlation sub-charts have been placed under the Bitcoin price graph in the order of mentioning at the opening of the post. We would observe the last two years since the pandemic started.
Currently, the correlation with the gold (orange) is absent as the reading is close to zero. Therefore, we could hardly name Bitcoin as a "digital gold" these days. However, the relationship between these two assets is not stable during the observation period. In spite of the current neutral position, we see a strong positive correlation from last September until the end of last year. However, during the remaining earlier part, the correlation goes back and forth from strongly positive to extremely negative readings.
The next is the U.S. monthly inflation rate (red). The current reading of 0.65 shows a strong positive correlation. Since last September, we can see it with a short drop at the end of November. Bitcoin has recently gone hand in hand with inflation as both are cooling down. However, in the past period, the relationship is extremely volatile either as with the gold, especially in the summer. The seasonality of monthly inflation could be the main factor for this.
It is time to check whether the most recent judgment can be the gauge of the broad stock market. Indeed, the correlation with the S&P 500 index (blue) is close to absolute as the reading stands at 0.90. Quite often, analysts take the most recent number to make a big word or even a hype. So let us check the remaining history in the past. Only in a single month of this January, the correlation was shakily fluctuating from zero to negative -0.50, then suddenly up to the current strong correlation. The similar behavior we could observe during last spring and summer. The other periods mainly show a positive correlation.
Among the three stances that we observed above, the broad stock market gauge is closer to the truth. The S&P 500 correlation was negative only during 120 bars out of 764 bars. It means that 84% of the time in the past two years Bitcoin was in a positive correlation with a broad stock market.
I would love to see your comments below to know your vision of Bitcoin.
Intelligent trades!
Aibek Burabayev
INO.com Contributor, Metals
Disclosure: This contributor has no positions in any stocks mentioned in this article. This article is the opinion of the contributor themselves. The above is a matter of opinion provided for general information purposes only and is not intended as investment advice. This contributor is not receiving compensation (other than from INO.com) for their opinion.


Bitcoin mainly reflects the massive funds delivered to International Banks.
Dear Buck,
Thank you for reading.
It is good to see your opinion here.
Have a great year ahead!
Aibek
It's a counter currency that correlates to economic activity and geopolitics in a non-traditional way.
Dear Mr. Impaler,
Thank you for sharing and reading.
Have a great year ahead!
Aibek