We have experienced an interesting time recently; almost every commodity is volatile and that provides excellent trading opportunities. Last month I refreshed the copper chart to show the miscorrelation of the two assets and, this time, we can see positive changes in the correlation.
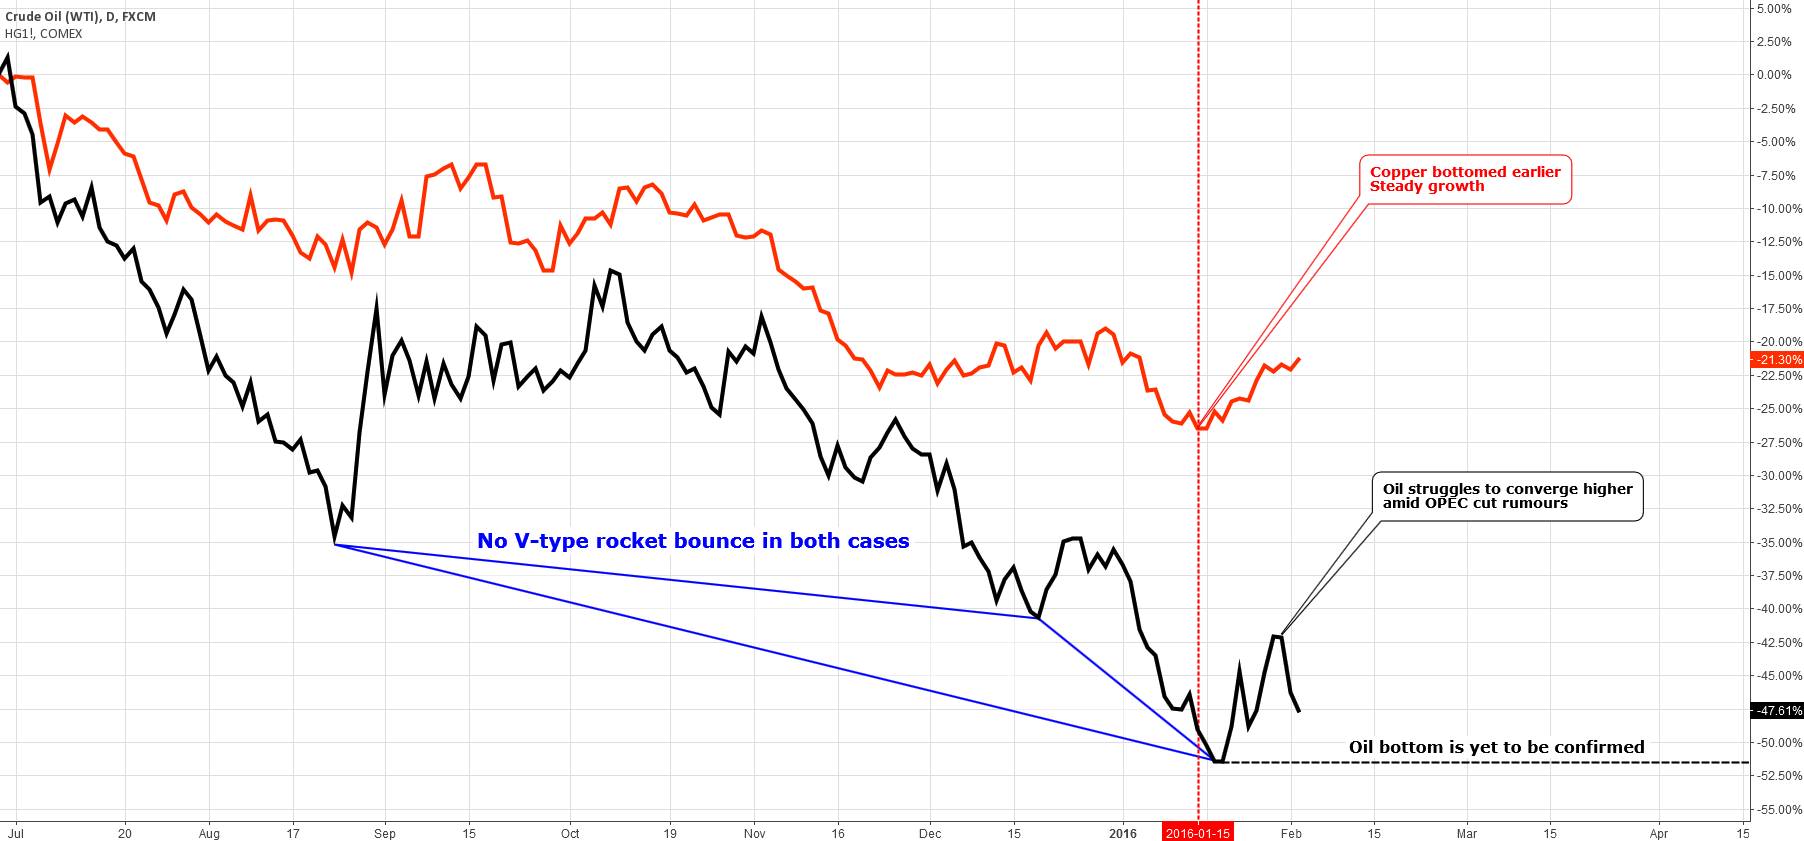
Chart 1. Copper-Crude Oil Correlation: Distant But Synced
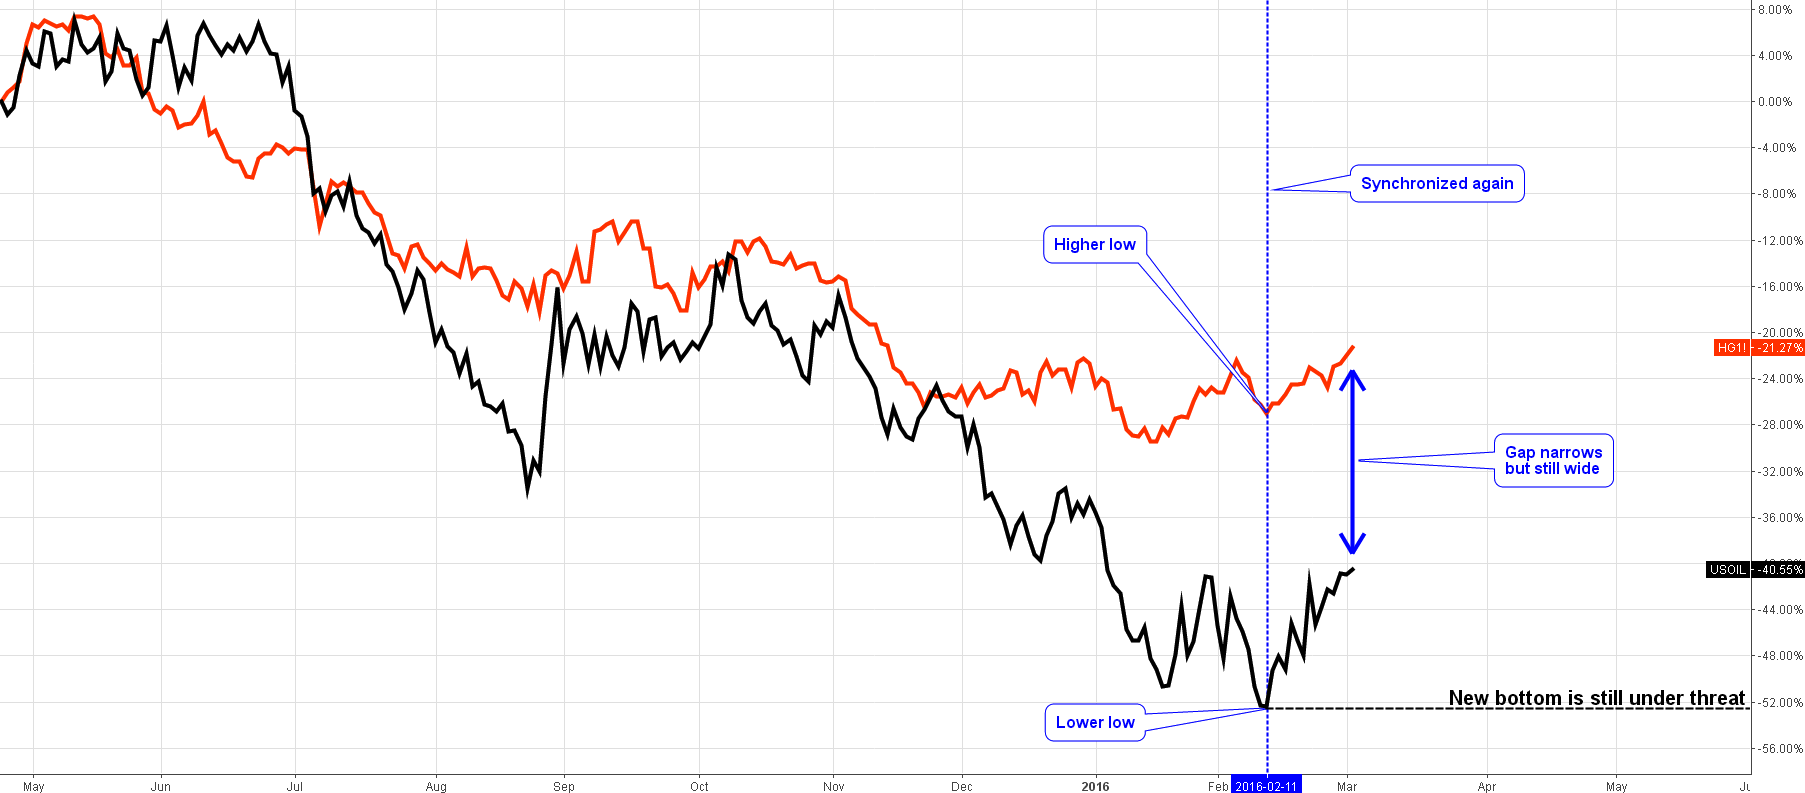
Chart courtesy of tradingview.com
As you can see in the chart above, both commodities reversed to the upside on the 11th of February (highlighted with the blue dashed vertical line). Copper managed to shape a higher low and crude oil hit the previous low level, making a new multi-year low, I doubt that we have seen the bottom yet.
Oil won back some disparity, but the gap is still broad and the overall move is flimsy with many zigzags on the graph line. Usually, “black gold” catches up with copper in a few large throws. Copper was less lucky and advanced only 6% compared to the 11% gain of crude. Continue reading "Copper Update: Flying High!"