U.S. Petroleum Inventory Rise 4.8 Million Barrels

According to the Energy Information Administration, U.S. petroleum inventories (excluding SPR) rose by 4.8 million barrels last week to 1.292 billion, and SPR stocks were unchanged. Total stocks stand 2 mmb below the rising, rolling 5-year average and 31.4 mmb higher than a year ago. Comparing total inventories to the pre-glut average (end-2014), stocks are 233 mmb above that average.
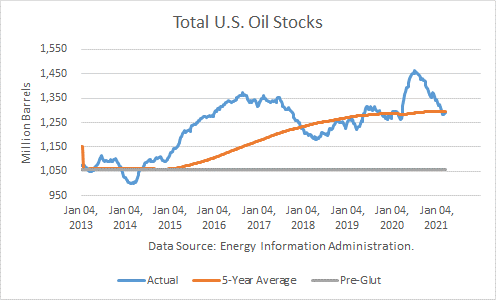
Total US Petroleum Stocks

Crude Production

Production averaged 11.0 mmbd last week, up 100,000 b/d from the prior week. It averaged 10.700 mmbd over the past 4 weeks, off 18.0 % v. a year ago. In the year-to-date, crude production averaged 10.736 mmbd, off 17.5 % v. last year, about 2.3 mmb/d lower Continue reading "U.S. Petroleum Inventory Rise 4.8 Million Barrels"

World Oil Supply And Price Outlook, March 2021

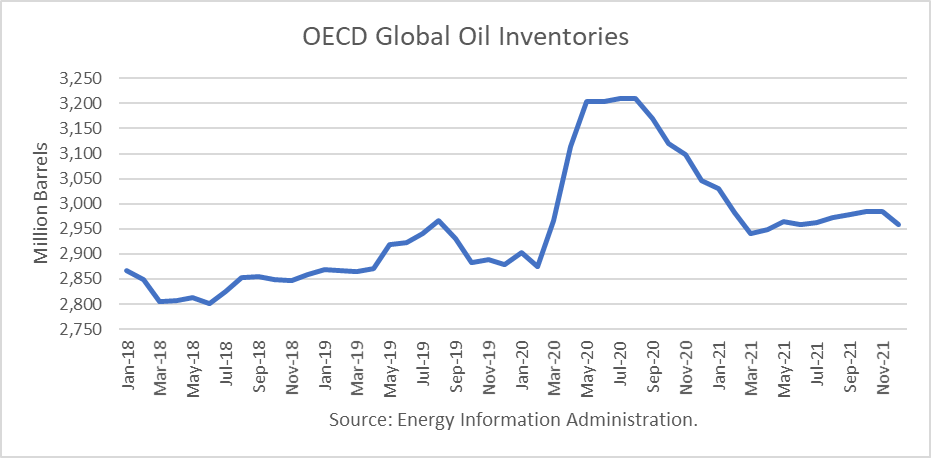
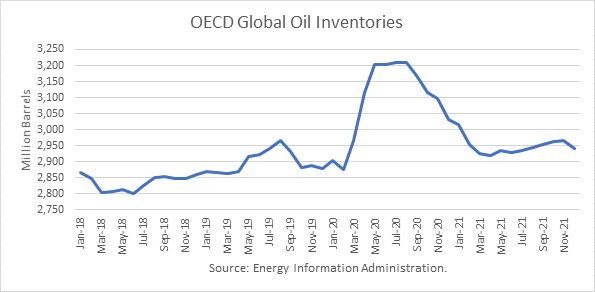
The Energy Information Administration released its Short-Term Energy Outlook for March, and it shows that OECD oil inventories likely peaked at 3.210 billion in July 2020. In February 2021, it estimated stocks dropped by 62 million barrels to end at 2.955 billion, 80 million barrels higher than a year ago.

The EIA estimated global oil production at 92.17 million barrels per day (mmbd) for January, compared to global oil consumption of 95.89 mmbd. That implies an undersupply of 3.72 mmb/d, or 104 million barrels for the month. That implies non-OECD stocks dropped by 42 million barrels in addition to the OECD stock draw of 62 million barrels.

For 2021, OECD inventories are now projected to draw by net 91 million barrels to 2.942 billion. For 2022 it forecasts that stocks will draw by 26 million barrels to end the year at 2.949 billion.

Oil

The EIA forecast was made incorporates the OPEC+ decision to cut production and exports. According to OPEC’s press release January 5, 2021: Continue reading "World Oil Supply And Price Outlook, March 2021"

U.S. Crude Oil Production Steady In December

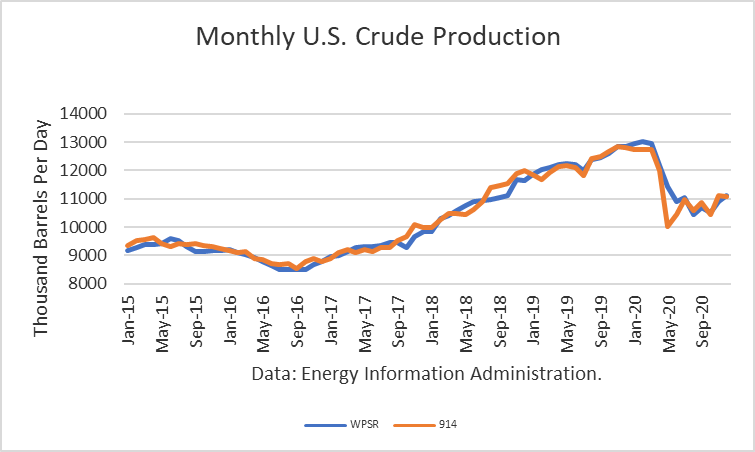
The Energy Information Administration reported that December crude oil production fell by 58,000 barrels per day, averaging 11.063 mmbd. This follows a 682,000 b/d rise in November. The December 914 figure compares to the EIA’s weekly estimates (interpolated) of 11.100 mmbd, a figure that was 37,000 b/d higher.

Crude Oil Production

Drops in production were experienced in New Mexico (42,000 b/d), North Dakota (38,000 b/d), and Texas (34,000 b/d). But output in the US Gulf Coast rose by 70,000 b/d.

Given the huge reduction in May, oil production dropped by 1.7 mmb/d over the past 12 months. This number only includes crude oil. Continue reading "U.S. Crude Oil Production Steady In December"

World Oil Supply And Price Outlook, February 2021

The Energy Information Administration released its Short-Term Energy Outlook for February, and it shows that OECD oil inventories likely peaked at 3.210 billion in July 2020. In January 2021, it estimated stocks dropped by 15 million barrels to end at 3.030 billion, 127 million barrels higher than a year ago.

The EIA estimated global oil production at 93.95 million barrels per day (mmbd) for January, compared to global oil consumption of 93.89 mmbd. That implies an oversupply of 60,000 b/d, or 1.9 million barrels for the month. That implies non-OECD stocks dropped by 17 million barrels.

For 2021, OECD inventories are now projected to draw by net 86 million barrels to 2.959 billion. For 2022 it forecasts that stocks will draw by 24 million barrels to end the year at 2.935 billion.

Oil

The EIA forecast was made incorporates the OPEC+ decision to cut production and exports. According to OPEC’s press release January 5, 2021: Continue reading "World Oil Supply And Price Outlook, February 2021"

U.S. Crude Production Rebounds In November

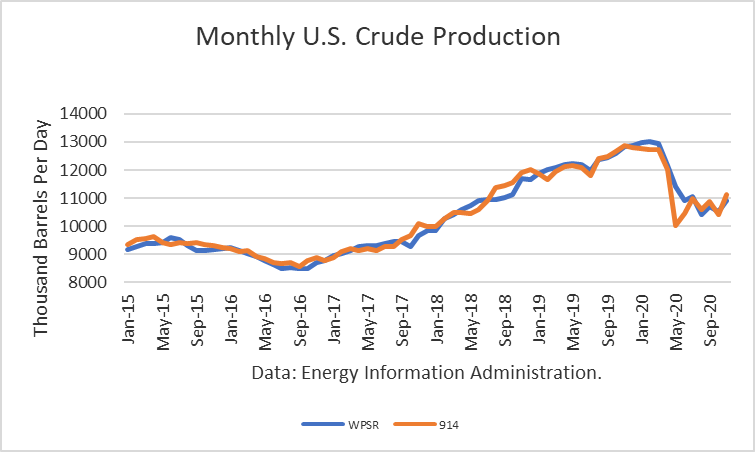
The Energy Information Administration reported that November crude oil production rose by 692,000 barrels per day, averaging 11.124 mmbd, its highest since March. This follows a 438,000 b/d drop in October and a 2 million barrel per day collapse in May. The November 914 figure compares to the EIA’s weekly estimates (interpolated) of 10.910 mmbd, a figure that was 214,000 b/d lower.

Crude

The primary cause of the rebound in production was the return of output in the U.S. Gulf Coast. USG production rose by 645,000 b/d from November, and Oklahoma output rose by 29,000 b/d, while New Mexico rose by 19,000 b/d. Continue reading "U.S. Crude Production Rebounds In November"