Picking the Right ETF to Avoid Contango

Exchange-traded fund investors who buy and sell inverse products regularly know what contango is. But the average investor probably doesn’t understand the ins and outs of contango and how it can hurt an investment.

With a little knowledge, you can actually use contango to your advantage and profit from an investment that is actually losing value.

What is Contango?

In a nutshell, it is the cost of purchasing futures contracts, options, and derivatives. When you invest in a leveraged exchange-traded fund, in order for the fund to gain that 2X or 3X leverage, it must buy monthly futures and options contracts.

Then towards the end of the month, the fund will sell its current contracts with very near-term expiration dates and purchase the following month's contracts that have a longer expiration date. In the process of doing this, the fund will sell a lower-priced contract and then buy a higher-priced contract.

This occurs because the further out the expiration date on an options contract, the more expensive the contract will be. This is because the buyer of the contract has time on their side and the seller is taking on more risk because the value of the underlying asset has more time to make a large move.

Since the price of the further dated contracts is always more expensive than what the fund is selling their current contracts for, the fund is constantly burning money. This money burn, is called contango. The money being ‘burned’ is literally reducing the amount of money the fund has to invest and, over time, causes the price of the ETF to slowly shrink. For example: a $25 ETF will only be worth say $20 over the course of a few months, even if the underlining investments that the fund tracks stayed absolutely the same during that whole period of time.

On a one-day basis, contango isn’t usually seen or felt by investors, but over the course of a few weeks or even months, it would definitely be felt.

How to Make Contango Work For You

One method of taking advantage of this contango money burn is too ‘short’ the different ETFs that experience this phenomenon. However, shorting stocks may not be in the cards for all investors because it is risky and capital intensive, especially when you are trying to short an investment over a long period of time.

Another, slightly lower risky way and with substantially lower capital outlays, is by purchasing put options in ETFs that experience high levels of contango. Buying put options is just slightly less risky since straight shorting a stock can actually end up costing an investor more than a 100% loss.

With put options, your max pain is 100% loss. If you short a stock and the stock runs higher, you could actually lose more than 100% of your initial investment since the stock price has no cap. Options are still risky, but again just slightly less risky.

So how does that work? Let’s say you want to short the Invesco QQQ Trust (QQQ), essentially the Nasdaq index. But you don’t want to just short it, you really believe it is heading lower so you want a little leverage.

You find the ProShares UltraPro Short QQQ ETF (SQQQ). This is an ETF that is 3X short the QQQ or the Nasdaq. The SQQQ will go higher in price when the Nasdaq goes lower. However, the SQQQ experiences contango due to the way it produces its 3 times leverage.

Now the ProShares UltraPro QQQ ETF (TQQQ) is the opposite of SQQQ. It gives investors 3X leverage to the upside of the Nasdaq or the QQQs. If you have a strong conviction that the Nasdaq is heading higher, the TQQQ is for you. But once again, contango will have an effect on your TQQQ returns if you hold it for more than one day.

Your option to not only avoid contango but also to make it work for you is to buy put options contracts in the TQQQ or the SQQQ depending on which way you think the Nasdaq is going to go.

The way these work is buying put contracts on the opposite ETF than the way they are designed to move. If you think the market is heading higher, you would normally buy the TQQQ ETF. But if you want to avoid contango, you actually buy the SQQQ put options. This is because if the market goes higher, the SQQQ will lose value and at the same time contango will be lowering the price on a daily basis just slightly.

Now if you think the Nasdaq is going lower, you would buy put options on the TQQQ, since this ETF will go higher if the market goes higher and lower if the market falls.

I am just using TQQQ and SQQQ as examples, but you can do this with any leveraged ETF that is going to experience contango. Also, you need to remember, contango will only affect an ETF's price if you are holding the ETF for a period longer than one day. And even if you hold it for just a few days, the effect will not typically be noticeable. This strategy is going to produce the best results if you plan to own the put options for a few weeks or months.

Matt Thalman
INO.com Contributor
Follow me on Twitter @mthalman5513

Disclosure: This contributor did not hold a position in any investment mentioned above at the time this blog post was published, but he does buy and sell put options in the TQQQ and SQQQ ETFs from time to time. This article is the opinion of the contributor themselves. The above is a matter of opinion provided for general information purposes only and is not intended as investment advice. This contributor is not receiving compensation (other than from INO.com) for their opinion.

Chart Spotlight: Generac Holdings (GNRC)

Every summer, power generator stocks, like Generac Holdings (GNRC) soar.

All thanks in part to hurricane season, intense heat, and the potential for blackouts. All of which increases demand for power generators from companies such as Generac Holdings.

  • In the summer of 2017, GNRC jumped from about $35 to $38
  • In the summer of 2018, GNRC jumped from about $50 to $56
  • In the summer of 2019, GNRC jumped from about $57 to $75
  • In the summer of 2020, GNRC jumped from about $112 to $191
  • In the summer of 2021, GNRC jumped from about $319 to $420

Even better, three out of the last four monthly MarketClub Trade Triangle signals highlighted a positive move for the stock.

The last monthly green Trade Triangle was issued at $118.86 on May 26, 2020 and pointed to a move higher all the way to the red monthly Trade Triangle at $391.85 on December 3, 2021.

GNRC Chart with Monthly Trade Triangles

Source: MarketClub

While summer 2022 hasn’t started off well for the GNRC, or for any stock out there, it is currently oversold. From a current price of $222.23, I’d like to see the GNRC stock challenge $300 a share again, near-term.

For one, the oversold generator stock could benefit as “demand for uninterrupted and reliable power supply has increased significantly, which has led to the sale of generators. Therefore, generators are considered a robust medium in providing power backup in industrial buildings, data centers, and at times in emergencies,” as noted by Astute Analytica. 

Two, according to TheFly.com: Northland analyst Donovan Schafer said Spruce Point's short report on Generac issued on June 22 "pedantically focuses on immaterial issues" and was "deeply-flawed." He maintains an Outperform rating and $370 price target on Generac shares.

Three, The Wall Street Journal says, “From California to Texas to Indiana, electric-grid operators are warning that power-generating capacity is struggling to keep up with demand, a gap that could lead to rolling blackouts during heat waves or other peak periods as soon as this year.”

Even the Electric Reliability Council of Texas (ERCOT), which operates Texas’ electric power grid, is asking households and businesses to conserve power, warning of rolling blackouts. The grid faces a “potential reserve capacity shortage with no market solution available,” ERCOT said.

Four, analysts at Wells Fargo just initiated coverage of the GNRC stock with an overweight rating, with a price target of $285. The firm believes Generac Holdings is a play on the instability of the current grid.

With that in mind, I believe shares of Generac Holdings (GNRC) could rocket higher. Again, from a current price of $222.23, I’d like to see GNRC stock at $300 a share again, near-term.

Ian Cooper
INO.com Contributor

Disclosure: This contributor did not hold a position in any investment mentioned above at the time this blog post was published. This article is the opinion of the contributor themselves. The above is a matter of opinion provided for general information purposes only and is not intended as investment advice. This contributor is not receiving compensation (other than from INO.com) for their opinion.
Will Rate Hikes Lead to Recession?

Although trading last week was limited to four trading days due to a holiday weekend gold had a deep and severe price decline.

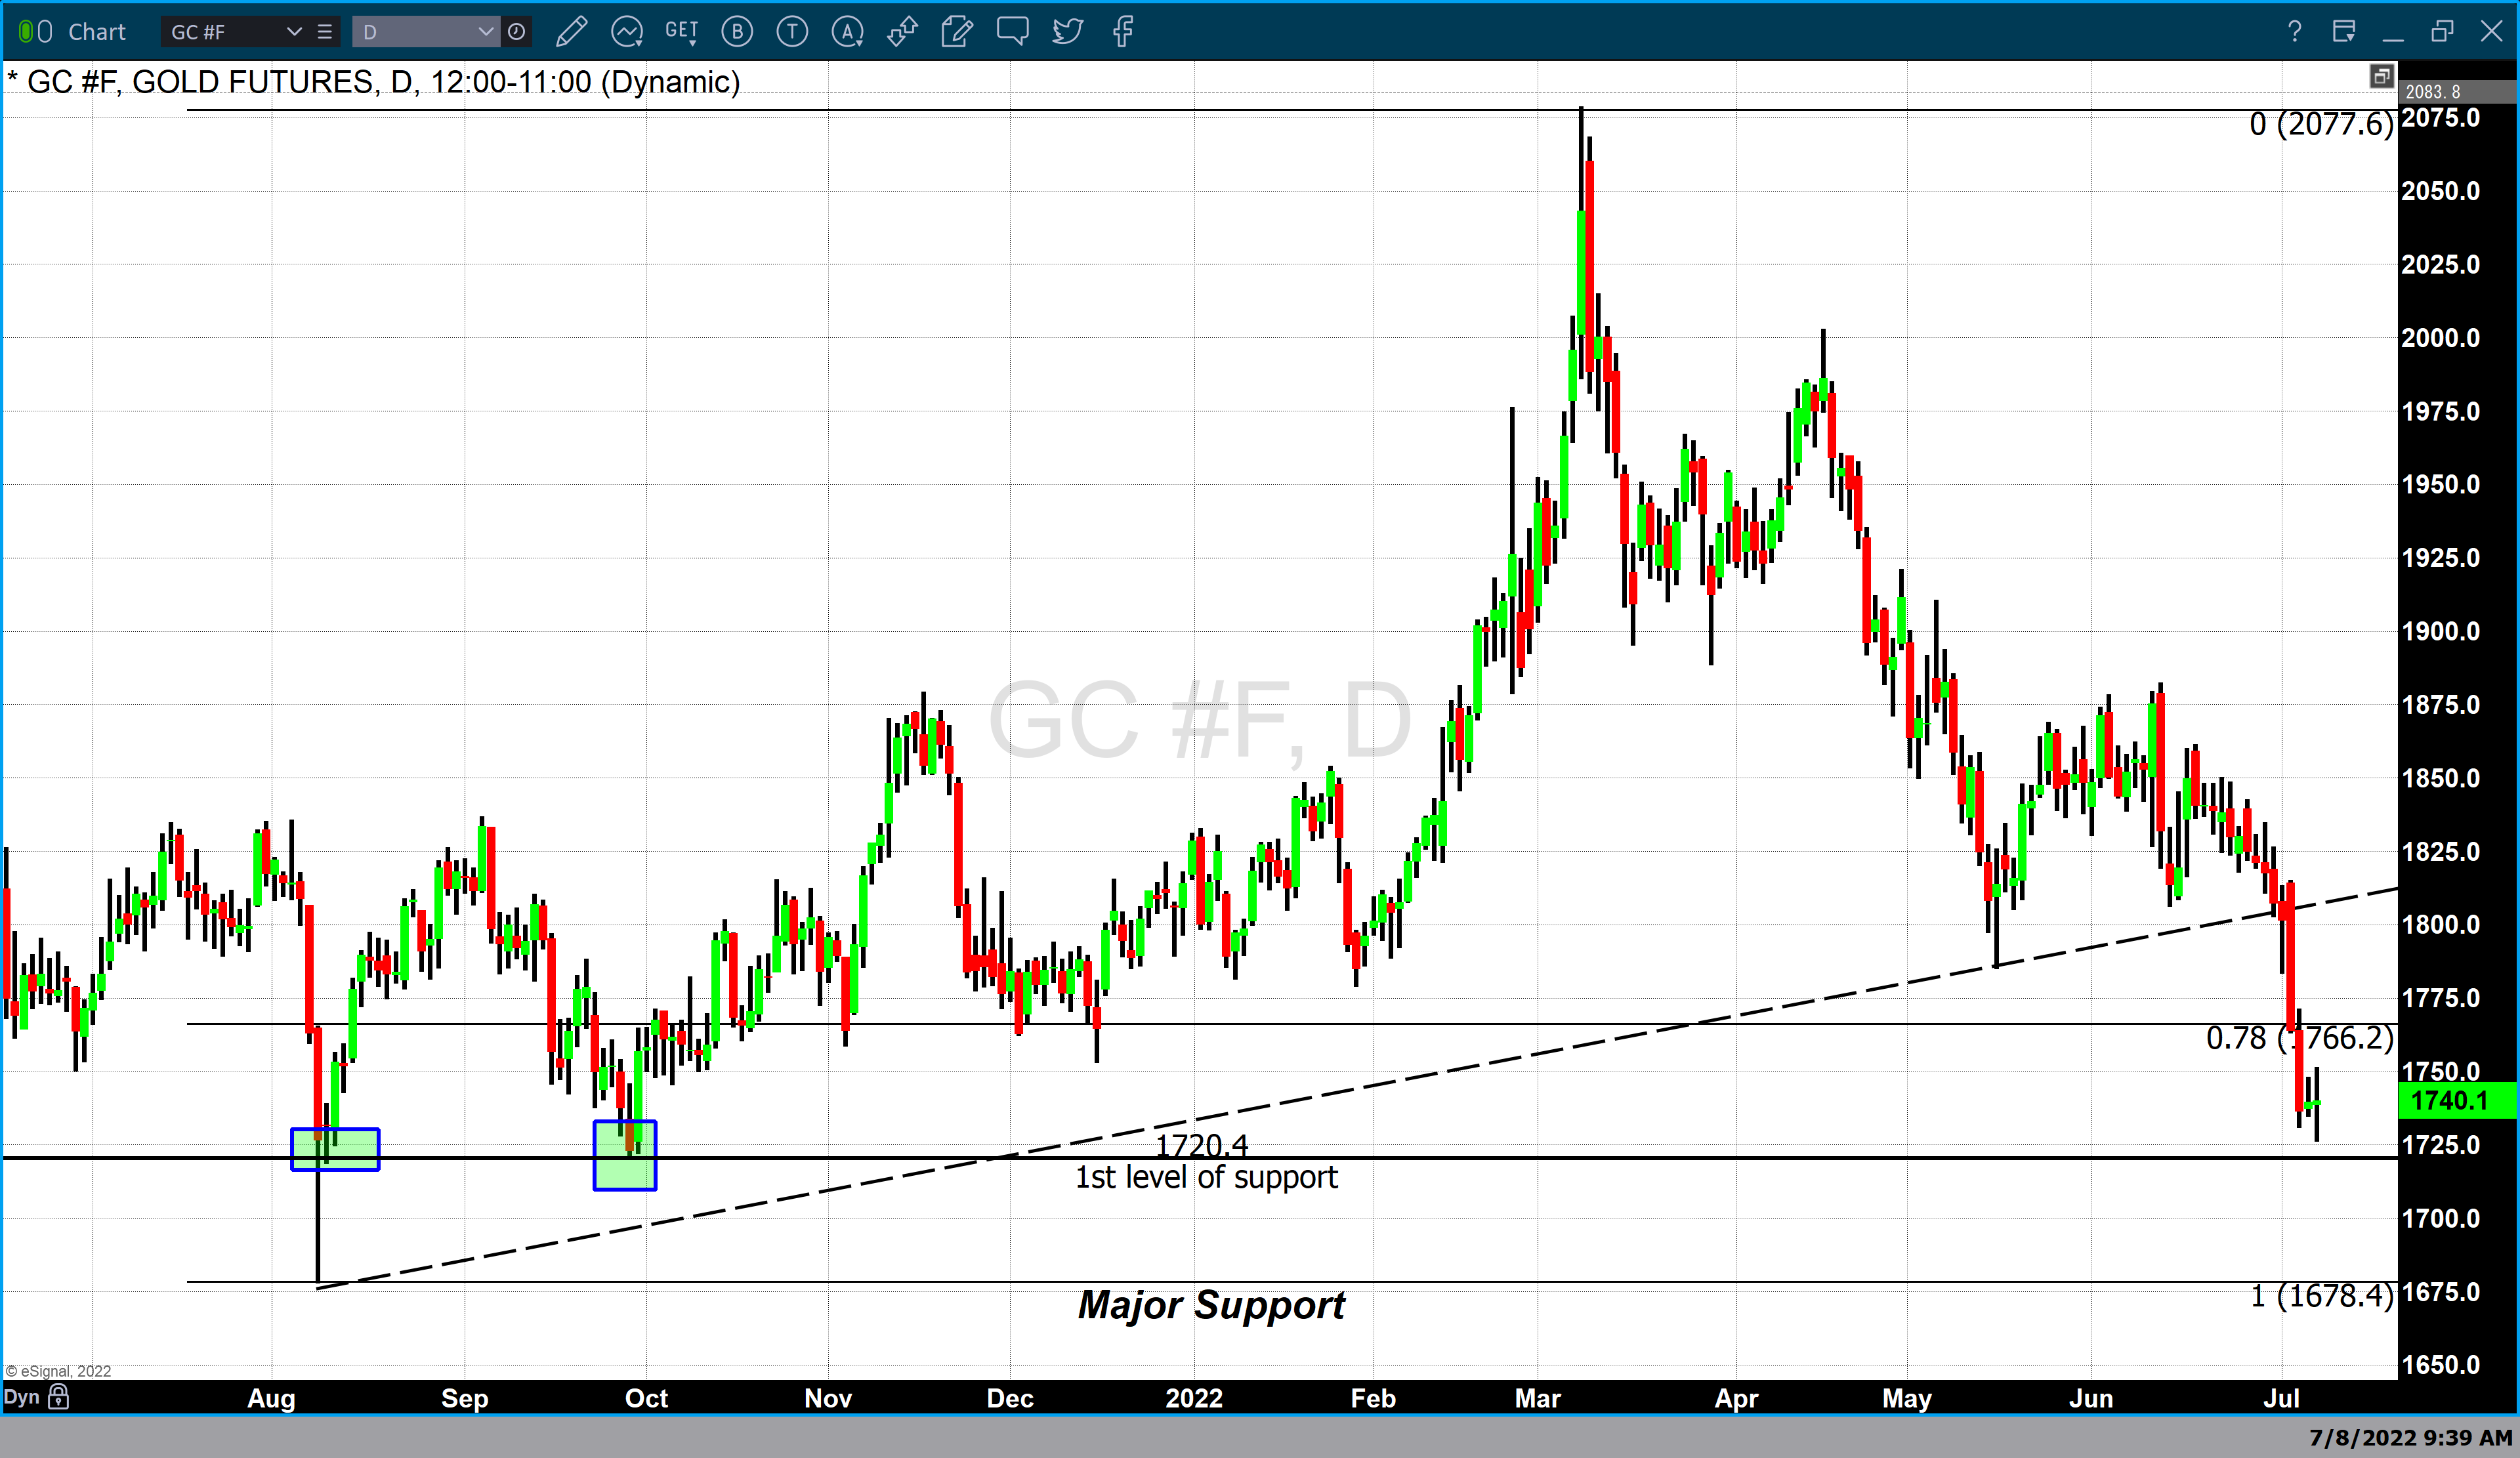
Gold lost approximately $74 in trading this week opening at approximately $1814 on Tuesday and settling at $1741 Wednesday. Last week’s price decline resulted in gold devaluing by 4%.

The Friday before last, gold opened above and closed below a support trendline that was created from two higher lows. The first low occurs at $1679 the intraday low of the flash crash that occurred in mid-August 2021. The second low used for this trendline occurred in the middle of May when gold bottomed at $1787.

Daily Gold Futures Chart

Gold closed just below that trendline one week ago, however it was Tuesday's exceedingly strong price decline of $50 that accounted for two-thirds of last week’s price decline and resulted in major technical chart damage.

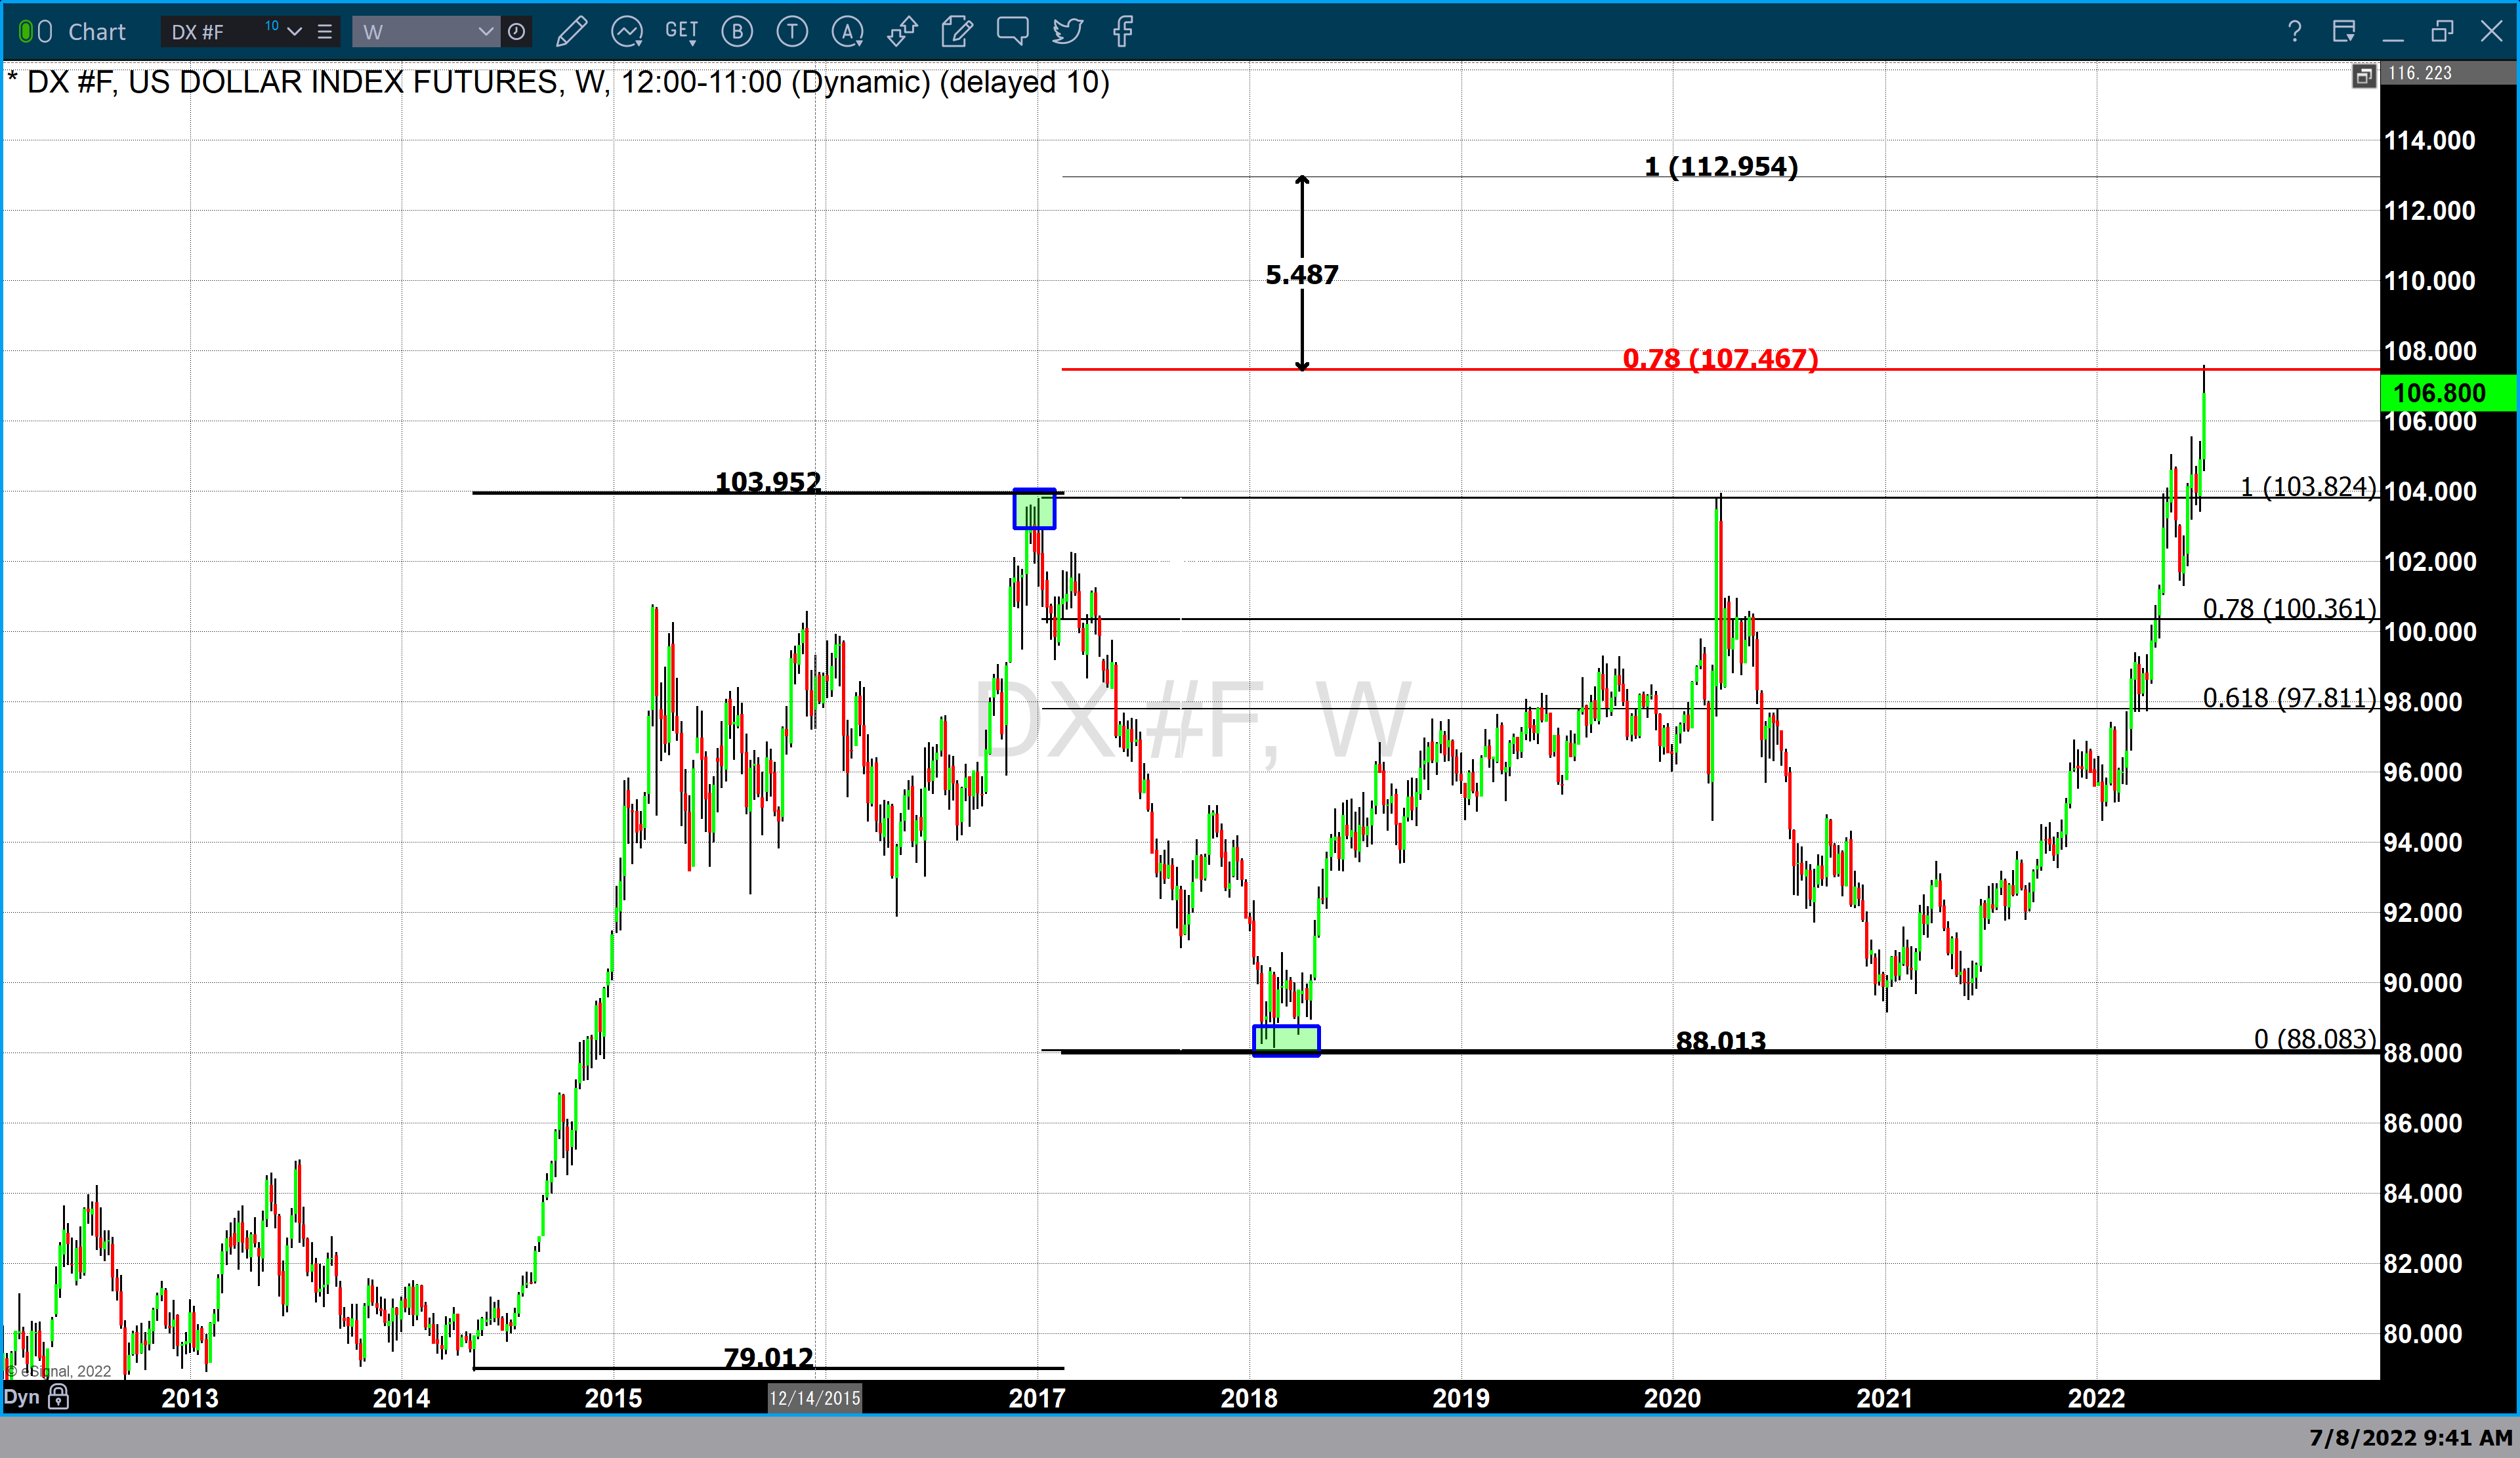
Daily DX Futures Chart

The primary force that moved gold substantially lower last week was dollar strength. The dollar index gained well over 2% last week accounting for over half of the price decline in gold.

Dollar strength was a result of traders and investors focusing on recent and future interest rate hikes by the Federal Reserve. Since March the Federal Reserve has raised rates on three occasions with each rate hike having a higher percentage increase than the last. The Fed raised rates by 25 basis points in March, 50 basis points in May, and 75 basis points in June.

Friday’s jobs report was forecasted to show that 250,000 jobs were added to payrolls last month. The actual numbers came in well above expectations with 327,000 jobs added last month. The unemployment level remained at 3.6%.

The fact that the actual jobs report came in above expectations strengthened the hand of the Federal Reserve to continue to raise interest rates substantially this month.

It is highly anticipated that the Federal Reserve will enact another 75-point rate hike at the July FOMC meeting. Before the Federal Reserve raised interest rates in March the fed funds rate was just ¼% or 25 basis points.

Currently, the interest rate set by the Federal Reserve is at 1 ½ % to 1 ¾. This would take the interest level set by the Federal Reserve to 2 ¼% to 2 ½%.

According to the CME’s FedWatch tool, there is a 93% probability that the Federal Reserve will raise rates once again by 75 basis points this month.

However, there are three more times that members of the Federal Reserve will convene for an open market committee meeting which leaves the door open for additional rate hikes. Because the Federal Reserve is data-dependent the number and size of the rate hikes will be based upon whether or not there is a substantial decrease in inflationary pressures.

That being said, it is most likely that this week’s CPI report will not have a dramatic impact on the Federal Reserve’s decision to raise rates as Chairman Powell and other Fed members have stated that the Federal Reserve will aggressively raise rates at the July FOMC meeting.

For those who would like more information simply use this link.

Wishing you, as always good trading,
Gary S. Wagner
The Gold Forecast

Has The FED Broken Inflation?

On Tuesday, July 5th, Crude Oil collapsed very sharply, down over 10% near the lows, in an aggressive breakdown of the price. The $97.43 lows reached that day were more than -14% from recent highs (set on June 29, 2022) and more than -21% from highs set on June 14, 2022.

Consumer Discretionary Spending Likely To Fall Further

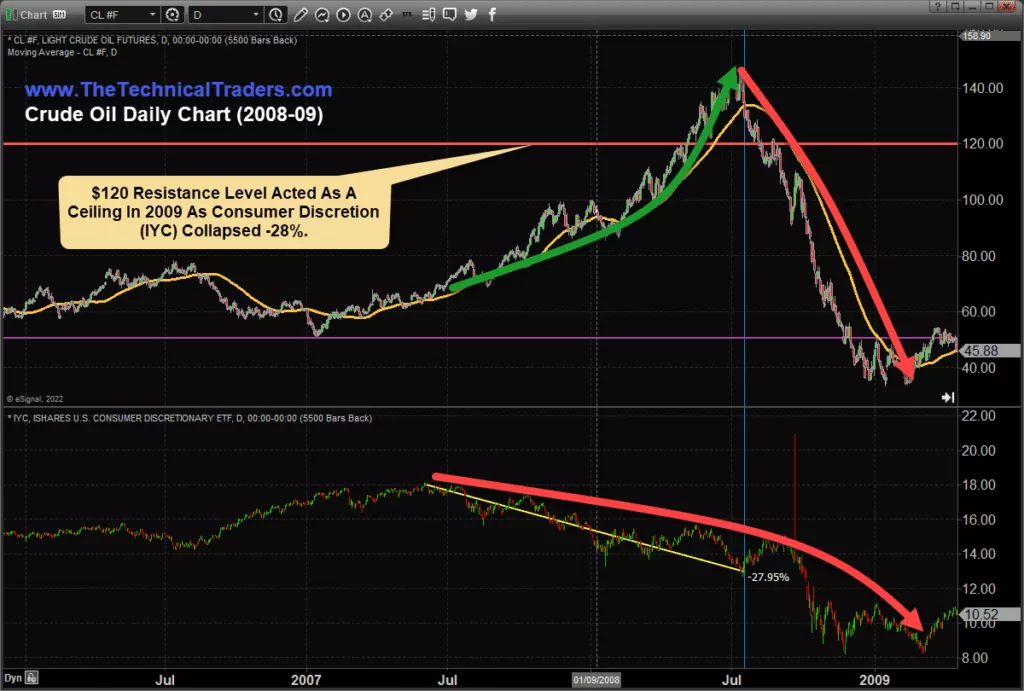
Recently, I shared a similar breakdown that took place in Crude Oil in 2009 and how tightening consumer spending often correlates with peaks in Crude Oil when crisis events happen.

Within that research article, I shared this chart highlighting the collapse in the Consumer Discretionary sector that preceded the downward collapse in Crude Oil. The interesting facet of this chart is we can see the inflationary price pressure in Crude Oil (and the general economy) countered by pressures put on consumers in the lower IYC price chart.

Consumers Lead The Global Economy – Watch IYC Closely

As prices rise, consumers are put under extreme pressure to keep their normal standard of living. As inflationary pressures continue, consumers make necessary sacrifices to manage their budgets – often going into debt in the process.

Eventually, this cycle breaks, and inflationary trends end. This is clearly evident on the chart below in July 2008 – as IYC, the Consumer Discretionary sector, collapsed by more than 27% before Crude Oil finally peaked and broke downward.

Crude Oil Daily Chart

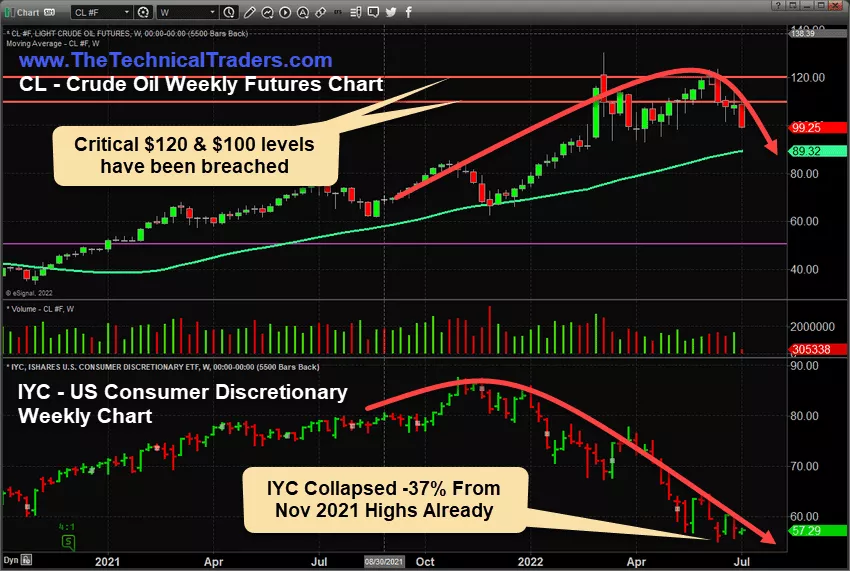
Since November 2021, IYC Has Fallen More Than -37%

This current Weekly Crude Oil & IYC Chart shows IYC has collapsed by more than -37% from the November 2021 highs – well beyond the -27% collapse in 2008 that preceded the 2008-09 Global Financial Crisis event. Is the current collapse in IYC a sign that a broad global crisis event has already begun to unfold beneath all the news and hype? Will Crude Oil collapse below $75ppb as the global economy shifts away from inflationary price trends and bubbles burst?

Crude Oil Daily Chart

The Deflationary Price Cycle Is Not Over Yet

If IYC falls below $55 in an aggressive downward price move, I would state the risks of a global deflationary price cycle (or extended recession) are still quite elevated. Currently, the $55 price level in IYC aligns with early 2019 price highs and reflects an extended price advance from the $12~$15 IYC price levels in 2008-09.

If the $55 IYC price level is breached to the downside, I expect the $37.50~$40.00 price level to become future support – as that price level reflects the COVID-19 event lows.

Still, these lower price targets represent an additional -32% decline in IYC and reflect a total of a -57% collapse in the Consumer Discretionary sector from the November 2021 peak levels. The potential target range of $37.50~$40.00 correlates with the 2008-09 GFC collapse range when IYC fell from $18 to lows near $8 (nearly -57%).

We are still very early in the shifting deflationary cycle phase after the US Fed started raising interest rates. Learn to protect and profit from this global event with my specialized investment solutions.

Learn more by visiting The Technical Traders!

Chris Vermeulen
Technical Traders Ltd.

Disclosure: This article is the opinion of the contributor themselves. The above is a matter of opinion provided for general information purposes only and is not intended as investment advice. This contributor is not receiving compensation for their opinion.

Worst First-Half Since 1970 - Time To Capitalize?

This has been the stock market’s worst first-half in over 50 years with inflation serving as the main culprit and a slew of ancillary pressures from China’s Covid lockdowns and the Ukraine/Russia conflict.

Through the first six months, no sector has been immune from the breath and reach of this bear market. The S&P 500, Nasdaq and Russell 2000 are well in bear market territory at June’s end.

Risk appetite across the spectrum has been eroded. The crypto market has collapsed, traditional IPOs and SPACs have dried up and several commodities have collapsed as of late.

Despite this massive wealth destruction, strategists from major Wall Street firms are forecasting that stocks will recapture most of their losses in the back half of the year.

The S&P 500 is expected to finish the year more than 20% higher from the end of June’s levels per the average year-end target derived from the top 15 Wall Street strategists. This forecast translates into the market recapturing most of the year’s losses, albeit finishing the year with a negative return of ~3%.

Deploying Capital

During bear markets or an extended period of a market-wide bear backdrop, investors have the unique opportunity to purchase heavily discounted stocks at a fraction of the price when compared to their peaks.

As history indicates, establishing long-term positions during corrections can lead to outsized gains over the intermediate and long term. As the selling pressure abates and the macroeconomic backdrop resolves, building equity stakes in high-quality companies bodes well for long term investors.

As the macro issues resolve over time, the markets will regain their footing and appreciate higher. The current market backdrop is the exact scenario where investors should be deploying cash on-hand to snap up heavily discounted merchandise in a diversified and dollar cost averaging manner.

Behind the Inflation Curve

The Federal Reserve has fallen far behind the inflation curve, putting through reactive interest rate hikes of 1.5 percentage points, with more to come throughout 2022.

Many politicians and executives have been sounding the inflation alarm since Q4 of 2021 to no avail while the Fed continued to buy bonds and pump liquidity into the system.

The latest inflation numbers by the Labor Department came in at 8.6%, the highest since December 1981. The reactionary Fed and runaway inflation have caused havoc on Wall Street while the Fed attempts to slam the breaks on the economy.

Second Half Bounce?

Although the first half of this year ranks among the worst in history, the selling may ease in the second half if history is any guide.

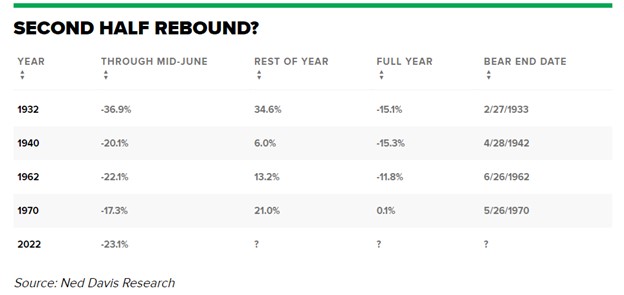
When the S&P 500 plunged 21% in the first half of 1970, it promptly reversed those losses to gain 26.5% in the second half and post a slight gain for the year. 1932, 1940, 1962 and 1970 saw first half decimation on par with 2022 however every one of those years saw a second half rebound.

Only one year saw the market recover the losses it incurred during the first half, in 1970 (Figure 1).

Figure 1

Figure 1 – Historical perspective of worst first half market performances and the respective full year outcomes when factoring in the second half of the year

Recession Possibility and Type

With the possibility of recession, there’s different underpinnings of a bear market that are broken out into cyclical-driven, structural-driven and “event-driven” stock declines of 20% or more.

Goldman Sachs (GS) holds the position that investors are experiencing a cyclical bear market which is marked by high inflation and rising interest rates. This combination results in price-to-earnings multiple contraction and thus a reduction in valuations.

The current climate is buffered against a structural bear market that is buoyed by strong corporate and household balance sheets. The positive side is that the average cyclical bear market lasts two years, far shorter than the average three in half years for a structural bear market. The average price decline during a cyclical bear market is only about 31% versus 57% during a structural one per Goldman.

Cash On-Hand

Deploying cash into an environment where the selling is relentless and indiscriminate can be a daunting task. However, for any portfolio structure, having cash on-hand is essential and in these environments is where this cash should be deployed in equities.

This cash position provides investors with flexibility and agility when faced with market corrections. Cash enables investors to be opportunistic and capitalize on stocks that have sold off and have become de-risked.

Initiating new positions and dollar cost averaging during these extended periods of weakness are great long-term drivers of portfolio appreciation. Absent of any systemic risk, there’s a lot of fantastic entry points for many high-quality large cap companies. Investors should not remiss and capitalize on this buying opportunity because it may not last too long.

Anchoring and Dollar Cost Averaging

Purchasing stocks at the exact bottom is nearly impossible however purchasing stocks at attractive valuations in a disciplined manner over time is possible.

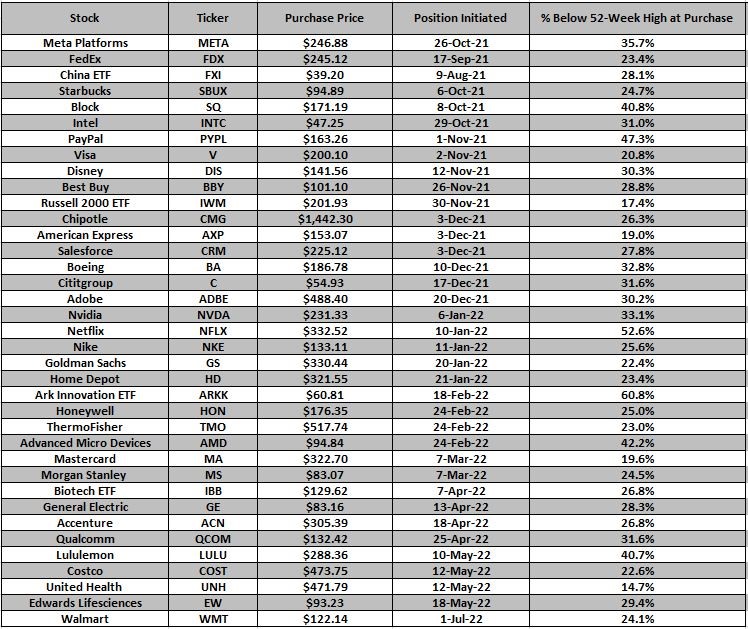
Dollar cost averaging is a great strategy to use when anchoring down into a position with an initial sum of capital and following through with additional incremental purchases as the stock declines further. The net benefit is reducing the average purchase price per share in a sequential fashion (i.e., reducing cost basis). An example of building out a high-quality portfolio with subsequent dollar cost averaging throughput this market weakness can be seen in Figure 2.

Figure 2

Figure 2 – Initiating positions in high quality companies with subsequent dollar cost averaging to build out a well-diversified portfolio. These long equity trades along with options-based trades can be found via the Trade Notification service.

Conclusion

This has been the stock market’s worst first-half in over 50 years where no sector has been immune from the breath and reach of this bear market. The S&P 500, Nasdaq and Russell 2000 are well in bear market territory at June’s end.

Despite this massive wealth destruction, strategists from major Wall Street firms are forecasting that stocks will recapture most of their losses in the back half of the year. The S&P 500 is expected to finish the year more than 20% higher from the end of June’s levels per top Wall Street strategists.

Purchasing stocks at the exact bottom is nearly impossible however purchasing stocks at attractive valuations in a disciplined manner over time is possible. During bear markets, investors have the unique opportunity to purchase heavily discounted stocks at a fraction of the price when compared to their peaks.

As history indicates, establishing long-term positions during corrections can lead to outsized gains over the intermediate and long term. As the selling pressure abates and the macroeconomic backdrop resolves, building equity stakes in high-quality companies bodes well for investors. The current market backdrop is the exact scenario where investors should be deploying cash on-hand to snap up heavily discounted merchandise.

Noah Kiedrowski
INO.com Contributor

Disclosure: Stock Options Dad LLC is a Registered Investment Adviser (RIA) firm specializing in options-based services and education. There are no business relationships with any companies mentioned in this article. This article reflects the opinions of the RIA. Any recommendation contained in this article is subject to change at any time. No recommendation is intended to constitute an entire portfolio. The author encourages all investors to conduct their own research and due diligence prior to investing or taking any actions in options trading. Please feel free to comment and provide feedback; the author values all responses. The author is the founder and Managing Member of Stock Options Dad LLC – A Registered Investment Adviser (RIA) firm www.stockoptionsdad.com defining risk, leveraging a minimal amount of capital and maximizing return on investment. For more engaging, short-duration options-based content, visit Stock Options Dad LLC’s YouTube channel. Please direct all inquires to

in**@st*************.com


. The author holds shares of AAPL, ACN, ADBE, AMD, AMZN, ARKK, AXP, BA, BBY, C, CMG, COST, CRM, DIA, DIS, EW, FB, FDX, FXI, GOOGL, GS, HD, HON, IBB, INTC, IWM, JPM, LULU, MA, MS, MSFT, NKE, NVDA, PYPL, QCOM, QQQ, SBUX, SPY, SQ, TMO, UNH and V.