
Each Week Longleaftrading.com will be providing us a chart of the week as analyzed by a member of their team. We hope that you enjoy and learn from this new feature.
This week's focus turns to the September 30 Year Treasury Bond Futures. The S&P 500 stock index has closed in the green 6 out of the past 7 trading sessions and many investors feel it may be time for stocks to partake in a minor correction. Typically, gold futures will receive a lot of the flight to safety bid in this case. Due to the recent break of consolidation in gold futures with the path of least resistance pointing down, 30 Year Treasury Bond Futures look to be the candidate to receive this bid.
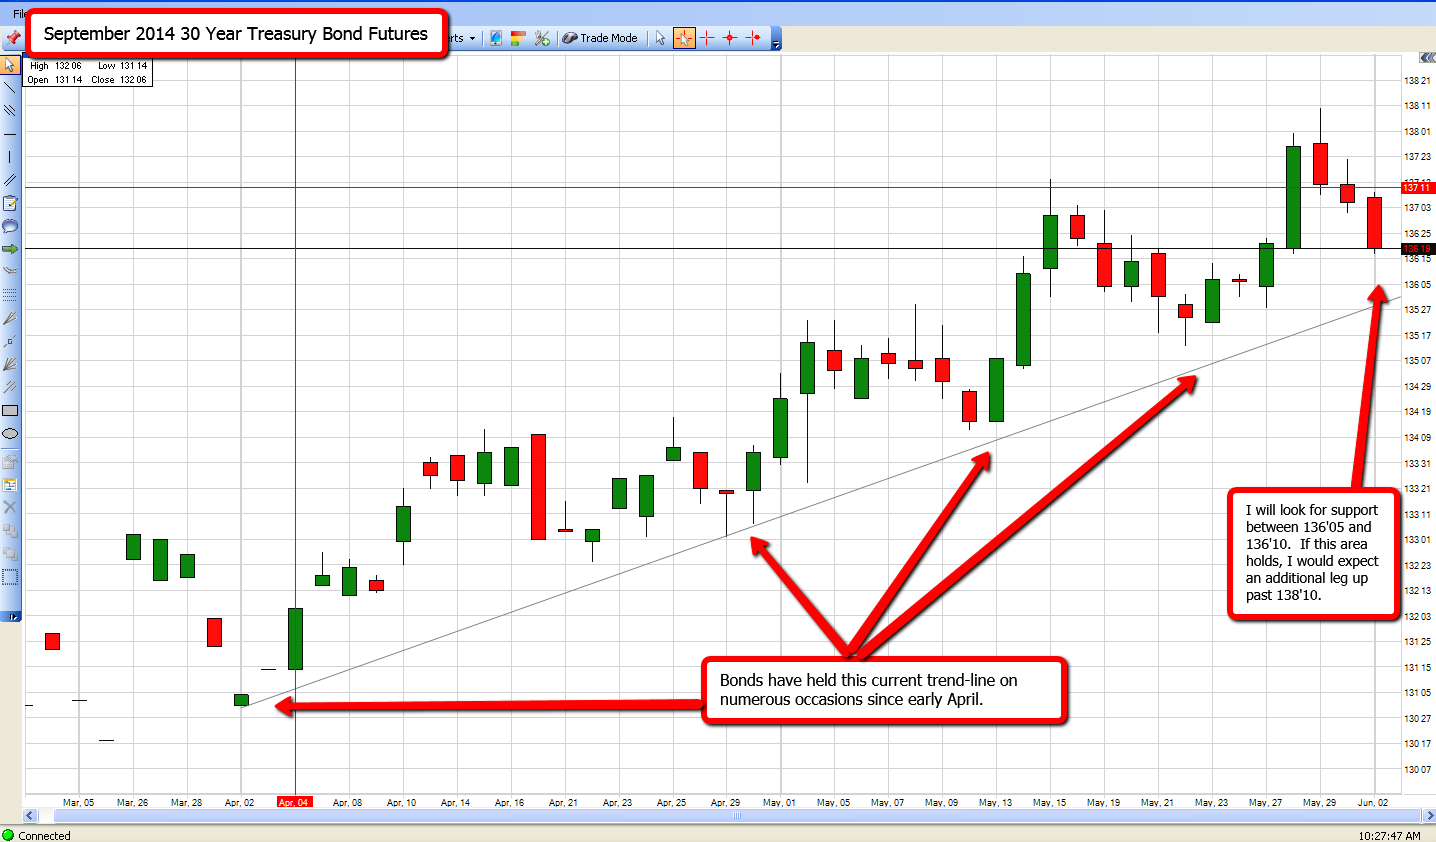
On the technical side, September 30 Year Treasury Bond Futures have held a perfect bullish market structure since early April. Since the trend has been established, the market has held on every test making higher highs and higher lows. Since establishing a new high print of 138.10 last week, we have once again seen a retracement towards the original trend-line as the market looks for support. Continue reading "Chart of The Week - 30 Year Treasury Bonds"