Chart of The Week - E-Mini S&P 500

Each Week Longleaftrading.com will be providing us a chart of the week as analyzed by a member of their team. We hope that you enjoy and learn from this new feature.

The major US stock indices pushed into record high territory late last week ahead of the start of the second quarter earnings season. To start this week, we see equity markets on a lower track following strong US economic data last week. Japan and European shares underwent profit taking, and with a relatively light US economic calendar ahead of the release of Wednesday’s FOMC minutes, we may see a round of profit-taking following last week’s record high print.

Friday, July 4th, saw a consolidation within the previous day’s range with light holiday volume after the 7 previous sessions had finished in the green. As we open the week on a bearish note, I would look to be a seller in the September E-mini S&P 500 just below Friday’s low of 1973.50 or better. My downside objective would be just above the underlying long-term trend-line at 1950. I would place a protective stop-loss order just above Friday’s high print at 1978.00. Should the market follow through to the downside, I would roll my stop order behind the position accordingly. Continue reading "Chart of The Week - E-Mini S&P 500"

Chart of The Week - E-Mini S&P 500

Each Week Longleaftrading.com will be providing us a chart of the week as analyzed by a member of their team. We hope that you enjoy and learn from this new feature.

As we start the week our attention turns to the September E-Mini S&P 500 (CME:ES.U14.E) as it looks to extend a 6 day winning streak. US equities have benefited from the dovish and accommodative tone from the FED last week. Existing home sales and manufacturing PMI data have added an additional boost to the market this morning. Coupled with last week’s support, the path of least resistance in the S&P 500 is a move higher. The primary concern that could spark profit taking in this market are the geopolitical risks surrounding the conflict in Iraq which has given early strength to the Crude Oil market.

As we turn to the chart, last week we saw a breakout of a consolidation pattern in an overall strong bull trend last Wednesday, June 18. Since the breakout from this consolidation, the market has legged decisively higher to put in new all time high levels to close out last week. The market put in a new high print in the overnight session of 1959.75 and I expect this bullish momentum to continue this week. Continue reading "Chart of The Week - E-Mini S&P 500"

Chart of The Week - Natural Gas

Each Week Longleaftrading.com will be providing us a chart of the week as analyzed by a member of their team. We hope that you enjoy and learn from this new feature.

To start the week, we will be watching Natural Gas futures closely. July Natural Gas saw a spike higher overnight to $4.89, but gave back those gains in the early morning hours. There is a measure of support in the market as Russia has halted Natural Gas flows to the Ukraine. Along with halted Natural Gas flows to the Uklraine, the US Natural Gas storage remains tight and sits well below the 5 year average. With a warmer weather outlook across the US, the case can be made for a bullish week in Natural Gas.

On the technical side, Natural Gas has sold off to a critical area of support at $4.70. This bullish trend-line was broken in mid-May and since become resistance in the market. After last week’s EIA inventory report on Thursday morning, the market spiked back above this trend-line with closes above it on both Thursday and Friday. In today’s session, Continue reading "Chart of The Week - Natural Gas"

Chart of The Week - 30 Year Treasury Bonds

Each Week Longleaftrading.com will be providing us a chart of the week as analyzed by a member of their team. We hope that you enjoy and learn from this new feature.

This week's focus turns to the September 30 Year Treasury Bond Futures. The S&P 500 stock index has closed in the green 6 out of the past 7 trading sessions and many investors feel it may be time for stocks to partake in a minor correction. Typically, gold futures will receive a lot of the flight to safety bid in this case. Due to the recent break of consolidation in gold futures with the path of least resistance pointing down, 30 Year Treasury Bond Futures look to be the candidate to receive this bid.

On the technical side, September 30 Year Treasury Bond Futures have held a perfect bullish market structure since early April. Since the trend has been established, the market has held on every test making higher highs and higher lows. Since establishing a new high print of 138.10 last week, we have once again seen a retracement towards the original trend-line as the market looks for support. Continue reading "Chart of The Week - 30 Year Treasury Bonds"

Chart of The Week - Gold

Each Week Longleaftrading.com will be providing us a chart of the week as analyzed by a member of their team. We hope that you enjoy and learn from this new feature.

Further Downside Expected as Gold Finally Chooses Its Direction

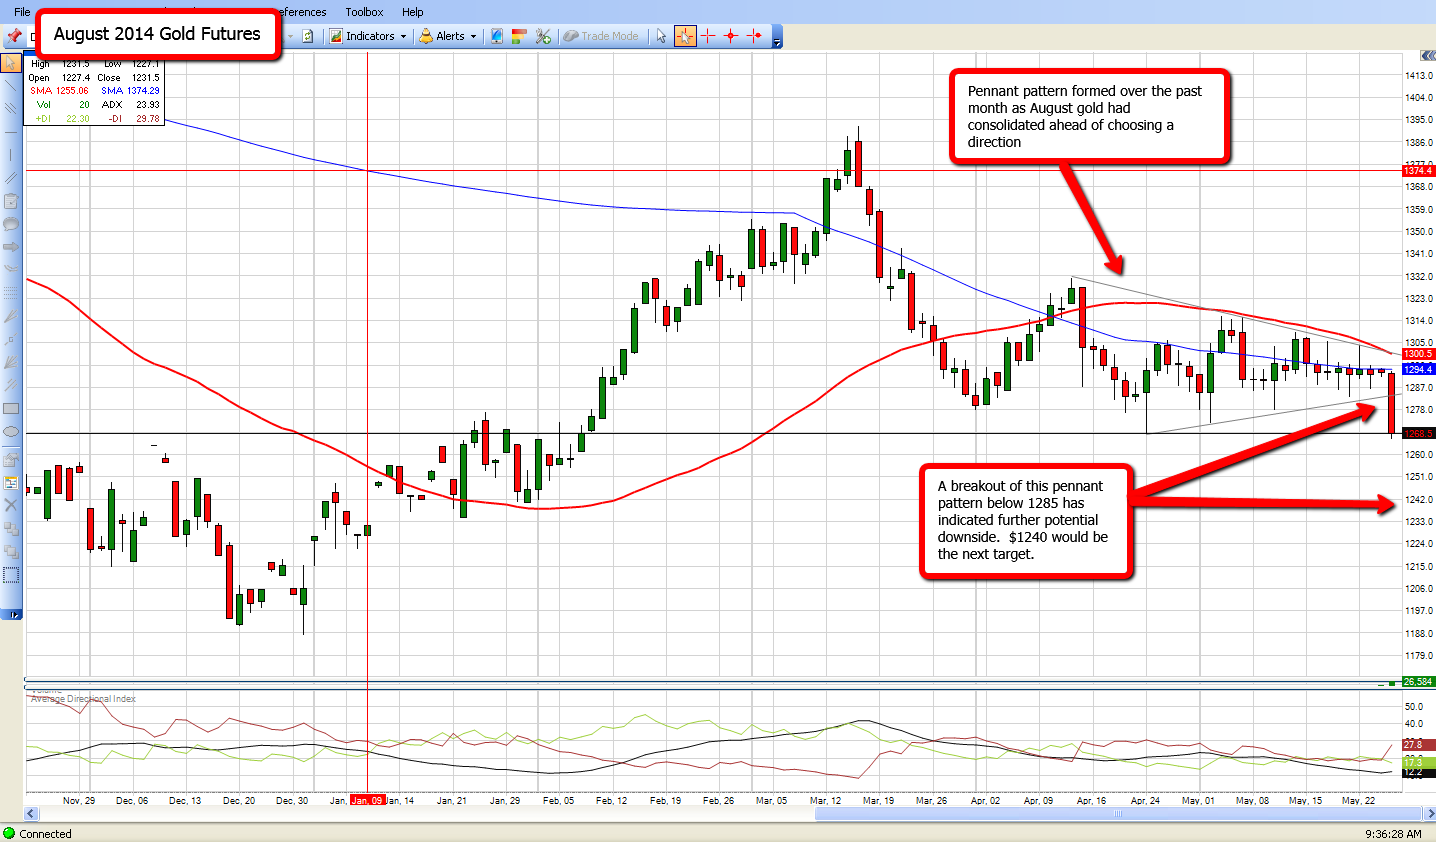
This week's market focus turns to August Gold futures, where a break out of recent consolidation may have finally determined the near term direction of Gold. The week starts out extremely bearish for Gold as the stock market continues to establish new all-time high levels. Recent economic numbers that have missed the mark have provided additional confidence to stock market investors that FED support will continue in the stock market. Optimism that stocks can continue their higher track has taken away from the safe haven appeal of gold.

Over the past month, August Gold futures have consolidated into a very tight range as the market has been deciding on its future direction. As of this morning the direction looks to be a sell off for the foreseeable future. With a break of the recent pennant pattern at $1285, the next downside target will be $1240. A close below $1280 in today’s session would confirm a further potential downside move over the coming months.

To take advantage of this downside continuation, I would look to purchase August put option strategies in gold that would take advantage of the next potential continuation move to $1240, while allowing roughly 2 months for the strategy to work. These strategies would expire on July 28th. Per strategy used, we would look to keep the maximum exposure in the market to $500 and the maximum profit potential to $2,500.

I advise clients on trading futures and futures options markets on a day to day basis. If you have any questions regarding this chart or questions regarding trading futures and futures options, feel free to call me directly at 888-272-6926.

Thank you for your interest,
James Leeney
Account Executive
Phone: (888) 272-6926
www.longleaftrading.com

** There is a substantial risk of loss in trading futures and options. Past performance is not indicative of future results. The information and data contained in this article was obtained from sources considered reliable. Their accuracy or completeness is not guaranteed. Information provided in this article is not to be deemed as an offer or solicitation with respect to the sale or purchase of any securities or commodities. Any decision to purchase or sell as a result of the opinions expressed in this article will be the full responsibility of the person authorizing such transaction.