Japan Shocks The Market With A Halloween Treat

Overnight actions by the Bank of Japan jump-started the equity markets to seven-year highs in that country, plunging the Japanese yen to its lowest levels since 2008.

The Bank of Japan's big market-moving announcement was that they will triple purchases of exchange-traded funds and real-estate investment trusts. This was clearly a big surprise to all the markets and it sent a big message to the currency markets. This will affect all the other Asian countries as they too will be forced to compete against a cheaper Japanese Yen. Can you say that the currency wars are just starting?

The move by The Bank of Japan (BOJ) was all that was needed to send gold and crude oil prices crashing to the downside.

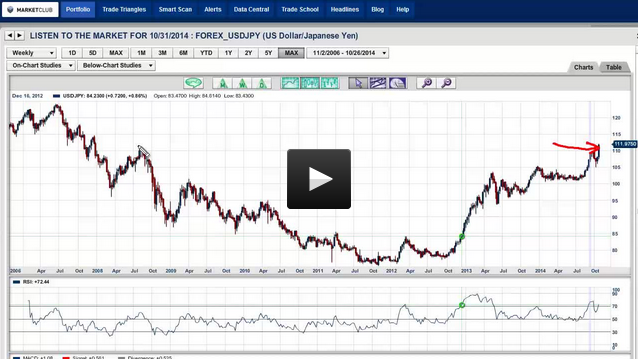
In today's video, I'll be looking at the U.S. Dollar VS the Japanese Yen (FOREX:USDJPY), gold (FOREX:XAUUSDO) prices, which gave a major sell signal today and crude oil (NYMEX:CL.Z14.E) prices, as they continue their downward spiral.

I'll also be following up on some of the stock picks that I talked about earlier this week:
Apple Inc. (NASDAQ:AAPL)
Alibaba Group Holding Limited (NYSE:BABA)
Facebook Inc. (NASDSAQ:FB)
Allergan Inc. (NYSE:AGN)

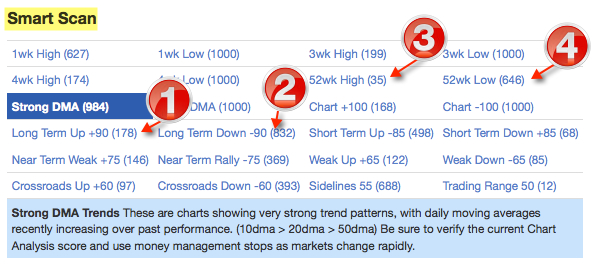
I'll also be looking for some stocks to trade over the weekend with "The 52-Week New Highs on Friday" trading rules.

As always, I welcome your comments and feedback. Please feel free to leave a comment or question below this post.

And don't forget follow us on Facebook and Twitter.

Have a great weekend everyone,
Adam Hewison
President, INO.com
Co-Creator, MarketClub

Amazon's Greatest Nightmare

Yesterday, Amazon.com Inc. (NASDAQ:AMZN) reported its earnings. They were a shocker and pushed the stock down over 9% overnight.

While Amazon was reporting no profits, Jack Ma, the head of Alibaba Group Holding Limited (NYSE:BABA), was in Hollywood looking to buy content and movie studios for his mammoth "find everything" website. Mr. Ma has also said publicly he wants to have US companies on his website so they can sell their products in China. Alibaba has over half a billion customers at the moment and is growing fast.

When I look at the stock of Amazon I can see that this stock hasn't gone anywhere and keeps losing money. Somewhere along the line, I think investors are going to say enough with Amazon already, it's got to start making money. Amazon has its fingers in a lot of pies including advertising, merchandising, newspapers, the cloud and probably a lot of other ventures you don't even know about.

But even if you didn't know anything about Amazon or Alibaba and you just look at the charts, you have to say that the chart on Alibaba looks a lot more positive than the one for Amazon. Now admittedly, Alibaba has not been trading in the US that long, but something seems to be right about what's going on with this company and its charismatic leader, Jack Ma.

While Amazon stock has gone up and come down, it's practically unchanged from where it was a year ago. It is down over $100 for the year, while AliBaba's stock is within 2 or 3% of its IPO high price of $99.70 on September 19th.

In today's video, I will be looking at both the stock of Amazon.com Inc. (NASDAQ:AMZN) and Alibaba Group Holding Limited (NYSE:BABA). I'll also be looking for some weekend trades of the 52-week kind and see what I can come up with. And of course, I will do a recap of the week and show you the winners and the losers.

Every success with MarketClub,
Adam Hewison
President, INO.com
Co-Creator, MarketClub

Will The Rally End?

Will Friday's rally continue or was it just a "dead cat bounce"? There is no doubt about it, we have been seeing lots of volatility in the markets. Is it likely to continue? Like in the past, it will continue until it stops and the market settles down. Nobody can give you an exact timeline when that's going to happen, but it will happen. In the meantime, having a solid game plan, one that you know has been successful in the past, will lead you to successful trades.

You've heard me say this before, the market can only move three ways, it can go up, down and sideways, that's it! When you boil it down to those simple terms, it is easy to see how investors can create many of their own problems by over-thinking a situation. You may have been guilty of this yourself at some point in time, I know I have. It is so easy to get caught up with the hubris of the market and lose sight of your investment goals. It's also easy to fall into the trap of listening to too many talking heads. Oftentimes when this happens, it leads to confusion and will leave you in a state of paralysis. Continue reading "Will The Rally End?"

How To Trade Like A Billionaire

Wouldn't it be nice if you could look over the shoulder of a billionaire to see exactly what they are doing to make the kind of profits they make?

Well, now you can.

It’s no secret we've had some fantastic moves in 2014. The question is, are they going to continue? The short answer is, some will and some won't. Today I want to share with how five well-known billionaires traded in one particular stock. I am going to put our Trade Triangles to the ultimate test to see how they performed against these billionaire traders.

The five billionaires are Jorge Lemann, Leon Cooperman, Ray Dalio, Daniel Loeb and David Einhorn. We know, thanks to SEC filings, that these five super traders hold positions in the stock of Andarko Petroleum Corp. (NYSE:APC).

I am going to show you about where they entered the market and their average price. I'm also going to show you where our Trade Triangles entered and exited the market. I believe the trend has changed for APC and while these billionaires are holding on, MarketClub's Trade Triangles are signaling a sidelines position.

Based on what we are seeing it is going to be an interesting fourth quarter.

This is where our five Billionaires are positioned right now: Continue reading "How To Trade Like A Billionaire"

Smart Scan Can Keep You On Track In Any Market

MarketClub's Smart Scan technology contains an amazing amount of information that you can use to help trade with the trend. Smart Scan can also alert you to changes in the bigger picture for the general market.

Let me share with you and example of how that would work. Looking at the graph below, you'll see a series of numbers, 1 through 4. I've illustrated the graph with these numbers to showcase what's going on right now in the general market.

1. "Long-Term Trend Up +90 (178)" - This means only 178 stocks have a +90 reading or higher.

2. "Long-Term Down -90 (832)" - This means 832 stocks are trending down and have a reading of -90 or lower. The number of stocks in a strong downtrend clearly outweighs the number of stocks in an uptrend over 4:1.

3. Looking at the stocks making "52-Week Highs," we see only 35.

4. The number of stocks making "52-Week Lows" is 646, which far outweighs the number of stocks that are making new highs.

At this point in time, I think it's clear to say that negative trend is winning out and in the majority.

In each of the 24 scans found in Smart Scan, it can really tell the story of the market. I highly recommend you spend some time looking at Smart Scan to see how you can successfully incorporate some of these scans into your own trading approach.

I find I constantly go back to this tool, not only to find stocks that are making new highs and trending higher, but also to see what's making new lows and what opportunities there are to short the market.

Every success with MarketClub,
Adam Hewison
President, INO.com
Co-Creator, MarketClub