One Way To Take Advantage Of This Difficult Period

For some time now, I've been talking about the volatility of the markets and for the last three days, volatility has been front and center. So, what is an investor to make of this and what opportunities are there to make money?

One way to take advantage of this difficult period is to look at our Smart Scan technology. In today's graphic, you can see that the market is beginning to tilt more and more to the bearish side of the ledger.

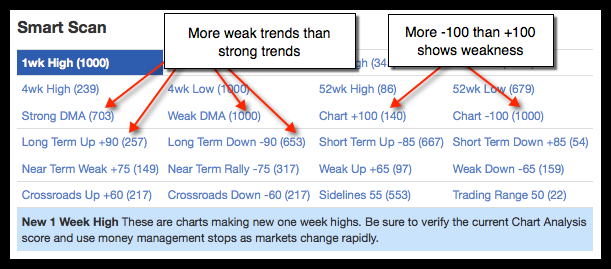
You can see by the Smart Scan numbers, the "Long Term Down" stocks now exceed the "Long Term Up" stocks by almost 400. When you look at "Chart +100", which means there's a strong uptrend, you see just 140 stocks trending upward. The number of stocks trending down in "Chart -100" is over 1000!

There are many stocks that are close to or have just reversed to the downside and you should be either on the sidelines in these stocks or shorting them.

With this being the last day of a tumultuous week, I expect the market to be a little exhausted and do not expect to see a big move either way today. Having just made that statement, I'm going to hedge myself and say as this is Friday, markets can and do sometimes go into turmoil.

This could be a perfect weekend for utilizing the "52-Week rules". In this case, I would favor the "52-Week rules" on the downside of the market. If you are not familiar with the rules for shorting the market, here they are again. Continue reading "One Way To Take Advantage Of This Difficult Period"

Will Ebola Have A Lasting Effect On The Markets?

Everywhere you turn, you see stories and videos about another Ebola outbreak. Major epidemics like the Ebola virus often create trends in healthcare, which can lead to major opportunities for investors.

Here is one stock that has been off the radar for most Wall Street firms, but is my favorite Ebola-related stock right now.

On July 30th of this year, this stock flashed a buy signal based on our Trade Triangle Technology - that was two and a half months ago! Do you remember seeing or reading about Ebola two and a half months ago? I expect not, as the Ebola virus was not front page news like it is now.

Chimerix To The Rescue

The chart below perfectly illustrates the upward trend of this stock. The green monthly Trade Triangle on the chart is where we were first alerted to the beginning of a bull trend for Chimerix, Inc. (NASDAQ:CMRX) on July 30th at $27.32.

Chimerix, Inc. (NASDAQ:CMRX) could have a great deal more room to go on the upside as a result of the Ebola pandemic. I do expect to see volatility in CMRX increase as it climbs a "wall of worry" from current levels. The more news that comes out about the spread or containment of the Ebola virus, the more volatility we could see. Overall, I do believe the trend for CMRX is on the upside and will remain that way for quite sometime. Always protect your capital with solid money management stops. Continue reading "Will Ebola Have A Lasting Effect On The Markets?"

Smart Scan Can Keep You On Track In Any Market

MarketClub's Smart Scan technology contains an amazing amount of information that you can use to help trade with the trend. Smart Scan can also alert you to changes in the bigger picture for the general market.

Let me share with you and example of how that would work. Looking at the graph below, you'll see a series of numbers, 1 through 4. I've illustrated the graph with these numbers to showcase what's going on right now in the general market.

1. "Long-Term Trend Up +90 (178)" - This means only 178 stocks have a +90 reading or higher.

2. "Long-Term Down -90 (832)" - This means 832 stocks are trending down and have a reading of -90 or lower. The number of stocks in a strong downtrend clearly outweighs the number of stocks in an uptrend over 4:1.

3. Looking at the stocks making "52-Week Highs," we see only 35.

4. The number of stocks making "52-Week Lows" is 646, which far outweighs the number of stocks that are making new highs.

At this point in time, I think it's clear to say that negative trend is winning out and in the majority.

In each of the 24 scans found in Smart Scan, it can really tell the story of the market. I highly recommend you spend some time looking at Smart Scan to see how you can successfully incorporate some of these scans into your own trading approach.

I find I constantly go back to this tool, not only to find stocks that are making new highs and trending higher, but also to see what's making new lows and what opportunities there are to short the market.

Every success with MarketClub,
Adam Hewison
President, INO.com
Co-Creator, MarketClub

5 Stocks That Avoided Yesterday's Implosion And Made 52-Week Highs

One thing I like to do on Friday is look at markets that are strong going into the weekend. After yesterday's implosion in the marketplace, I thought that was going to be a hard thing to do. Thanks to MarketClub's Smart Scan technology, I was able to find five socks that bucked yesterday's downturn and are looking very good.

Now you may remember the rules I have talked about for "The 52-Week New Highs on Friday" weekend trade, but just in case you don't know what they are, here they are again.

Rule #1: On a new 52-week high, when the market closes at or near its high on a Friday, buy long and go home for the weekend.

Rule #2: Exit the long position on the opening the following Tuesday.

Rule #3: If the market opens lower on Monday, exit this position immediately.

These are the only three rules you need to trade "The 52-Week New Highs on Friday" successfully.

I invite you to watch the video and look at the five stocks I found using Smart Scan. Then 10 to 15 minutes before the market closes today you can see which stocks are closing at or near their highs for the day.

Have a great weekend everyone,
Adam Hewison
President, INO.com
Co-Creator, MarketClub