The Fed’s tightening puts hard pressure on the broad stock market and chip makers are not the exception. The strong labor market statistics and ongoing inflation pressure supports the hawkish mode.
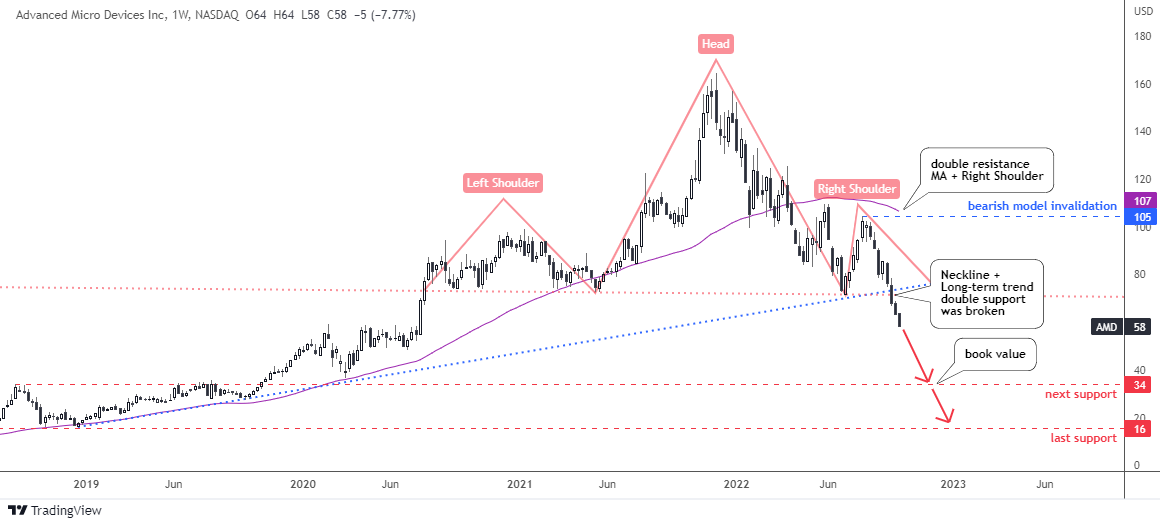
If one thinks that the sell-off might be over, there is a chart below that I spotted a disastrous model for a well-known chip maker Advanced Micro Devices, Inc. (NASDAQ:AMD).
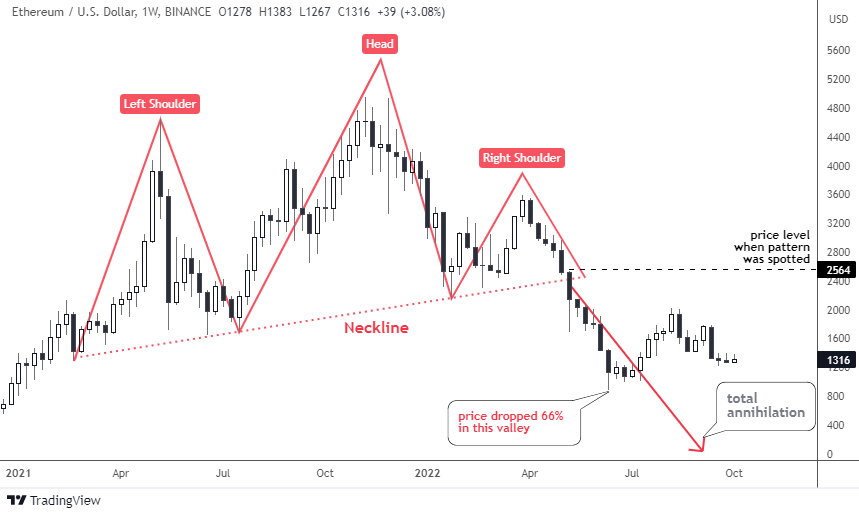
You definitely know this chart pattern I spotted for you. It is a Head & Shoulders reversal model. Last time this notorious chart pattern appeared in my posts was in May on the chart of Ethereum cryptocurrency. I updated it for you below to illustrate the historical sample.
As soon as the price crossed below the Neckline beneath $2,400, Ethereum collapsed as it had lost a tremendous 66% down in the valley of $884 in June from the post level of $2,564.
This is how this model has played out before and that is what we could expect in the next chart of AMD below.
The Head & Shoulders pattern (pink) here is more balanced compared to up-sloped model in the Ethereum chart. The Neckline touch points are located almost exactly at the same level of $72, hence it is a flat line. The Head is quite tall above the wide Left Shoulder and the narrow Right Shoulder. The top of a latter offers a strong resistance and the invalidation point. Continue reading "Familiar Pattern in the AMD Chart"


