DOW Drops For Sixth Straight Week

Choppy trading was the theme of the day on Friday after a dramatic week that saw the DOW post both its best and worst days since 2020, with the worst day being Thursday, when it dropped over 1,000 points. The DOW shed 98.60 points, or -0.30%, to finish at 32,899.37. The S&P 500 shed -0.57% to close at 4,123.34, while the NASDAQ fell -1.40% to end the week at 12,144.66.

The losses on Friday clinched a losing week for all three major indexes despite starting off the week with three straight positive sessions. The DOW finished down -0.24% for its sixth consecutive negative week. The S&P 500 and NASDAQ finished with losses of -0.21% and -1.54%, respectively, for their fifth straight losing week. Continue reading "DOW Drops For Sixth Straight Week"

NASDAQ Post Worst Month Since October 2008

The stock market once again plunged Friday, with the NASDAQ suffering its worst monthly loss since October of 2008, losing -13.26%. In addition, the DOW and S&P 500 both finished April in the negative, with losses standing at -4.91% and -8.80%, respectively.

On a daily level, the NASDAQ lost -4.17% to close at 12,334.64. The S&P 500 retreated by -3.63% to 4,131.93, and the DOW shed 939.18 points, or -2.77%, to end the week at 32,977.21.

On a weekly level, both the NASDAQ and S&P 500 posted their fourth straight weekly loss with losses of -3.93% and -3.27%. The DOW continued its downward trend with another weekly loss of -2.47%, its fifth straight weekly loss. Continue reading "NASDAQ Post Worst Month Since October 2008"

Bitcoin Still Shines Like A Sun

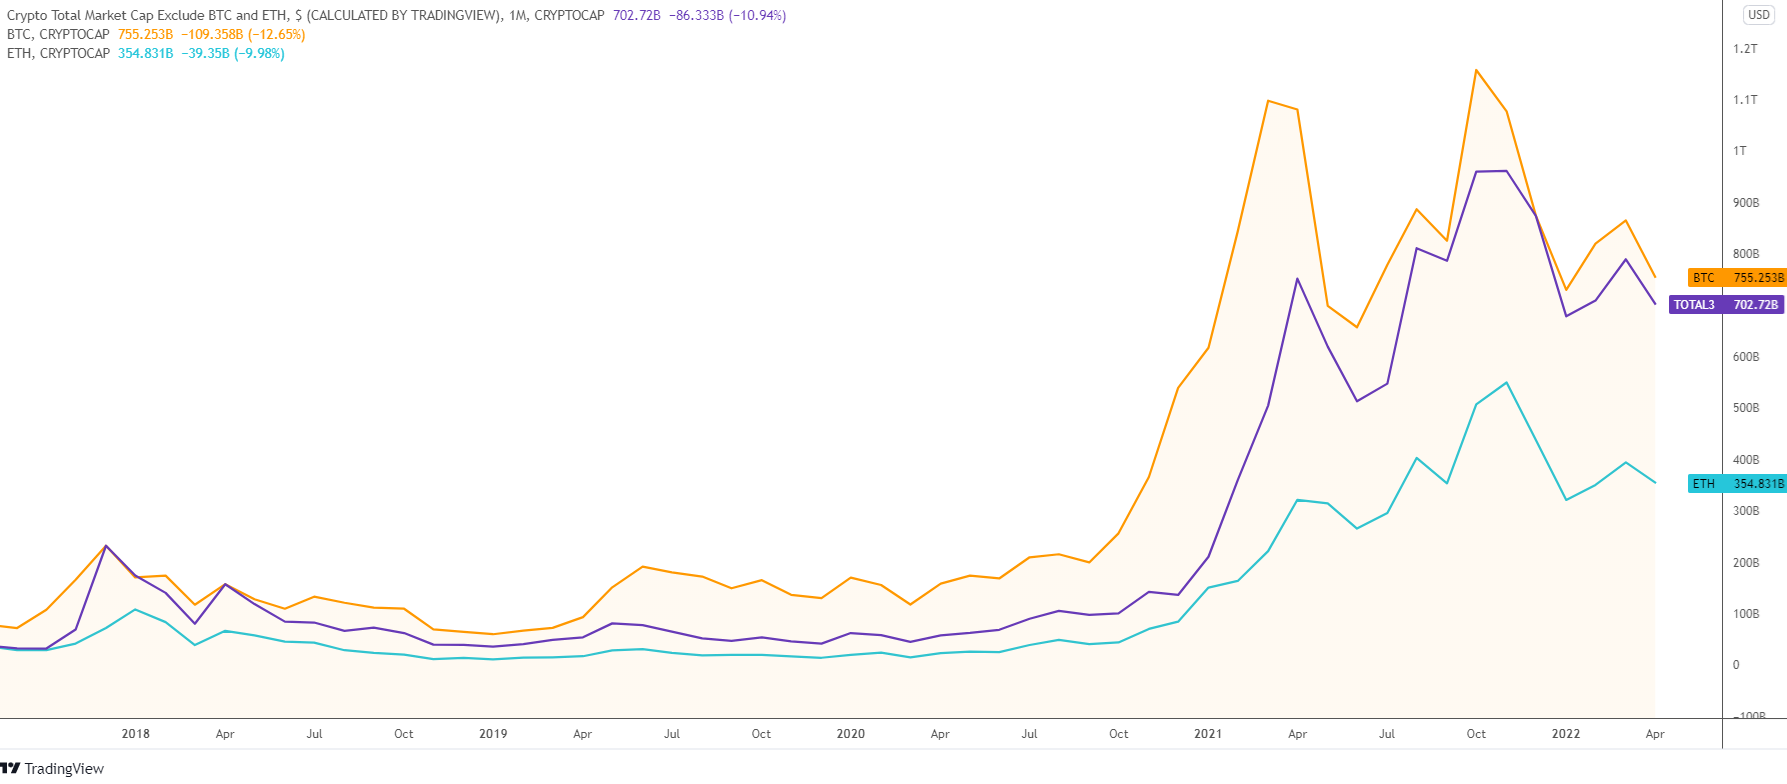
In this post, I would like to show you what happens to the structure of the crypto market over time as new stars join the universe with hopes of taking down the shining star, Bitcoin.

Chart 1. Market Cap Comparison: Bitcoin, Ethereum, and Altcoins

Bitcoin vs. Ethereum

The chart above starts in September of 2017. Both altcoins and Ethereum had a market cap of around $30 billion, while the main coin had more than double that at $72 billion. The latter started to rally at once, reaching the top of $231 billion by the end of 2017. Altcoins followed Bitcoin with a delay of one month; however, the growth was more robust and the market cap caught up with that of the main coin rising more than seven-fold. It was that very rare moment when the market cap of altcoins could touch the “Sun” of Bitcoin in the considered period. Continue reading "Bitcoin Still Shines Like A Sun"

DOW Plunges More Than 900 points

The stock market plunged on Friday, with the DOW suffering its worst one-day loss since the beginning of the pandemic falling 1,019.00 points at its lowest point.

The DOW fell 981.36 points, or -2.8%, to finish at 33,811.40, its worst day since 2020. The S&P 500 was down -2.8% at 4,271.78, for its lowest day since March, and the NASDAQ fell -2.6% to end the week at 12,839.29.

On a weekly level, the DOW closed the week with a fourth straight weekly loss standing at -1.9%. The S&P 500 and NASDAQ were not far behind, posting weekly losses for the third straight week, with each index losing -2.8% and -3.8%, respectively. Continue reading "DOW Plunges More Than 900 points"

Bitcoin Tested By Uncertainty... And Wins!

I probably don’t have to tell you that no matter where you turn these days, there’s one thing you can be certain of.

Uncertainty.

That’s right. There’s a ton of uncertainty no matter where we turn. And that’s true, as a matter of fact, in our daily lives: While we try to make things as predictable and certain as possible, in the end, we’re all just flat-out exposed to uncertainty.

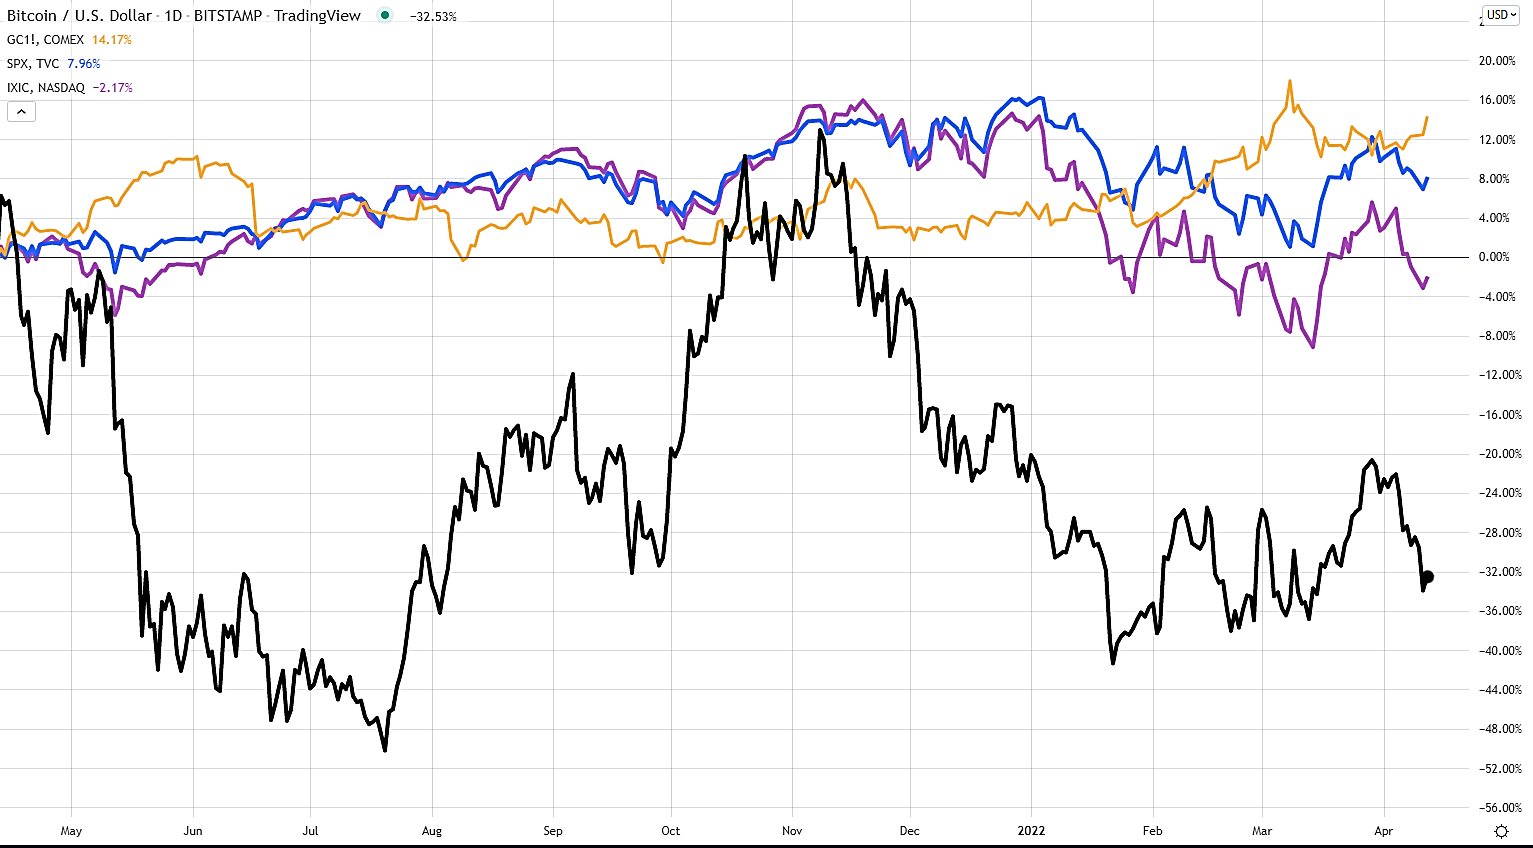
It’s also true when it comes to our investments in gold (GC1), stocks (SPX), tech (NASDAQ), and Bitcoin (BTC). In fact, that uncertainty is even more at play. See for yourself.

Bitcoin Daily Chart

As you can see from this chart of gold, stocks, and tech, every asset has had its fair share of volatility over the past year. In fact, the performance of gold, stocks, and tech have ranged from 18% to the upside (gold) to -9% to the downside (tech) during the last one-year performance period. Lumping all those assets together, that’s a net swing of 27% from top to bottom. Whew!
But when you throw Bitcoin into the mix, it’s clear that BTC makes that uncertainty look like a walk in the park. Why? Because over the same one-year performance period, Bitcoin has ranged from 13% to the upside (Nov 2021) to -50% to the downside (July 2021). That’s a net swing of 63% from top to bottom or about 2.3 times the performance volatility of gold, stocks, and tech. Continue reading "Bitcoin Tested By Uncertainty... And Wins!"