Q4 Approaching: Markets In Rarified Air

The bulls have been trampling the bears in a near orderly uptrend for the past ~10 straight months now. The bear thesis couldn’t have been more wrong despite the markets facing a trifecta of rising interest rates, an unknown delta variant backdrop, and the Federal Reserve tapering later this year. The major indices are in unprecedented territory breaking through all-time high after all-time in what seems to be a daily occurrence. With Q4 2021 coming into the picture, the S&P 500 is up over 20% and places the market in rarified air.

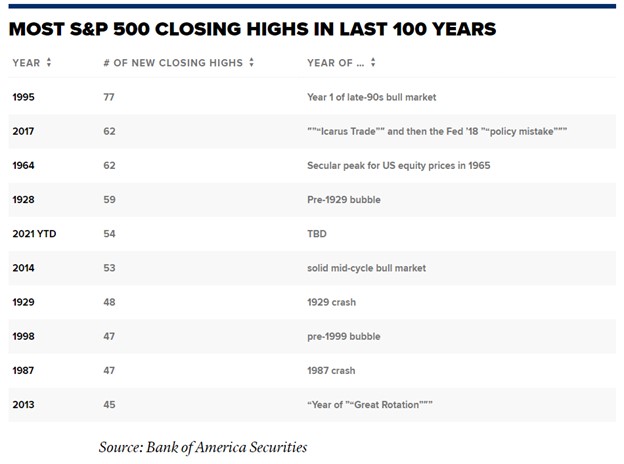
The S&P 500 index recorded its 53rd record high on September 2nd, which makes 2021 the 5th-ranked year over the past century in terms of record highs, per Bank of America. This significant milestone has been achieved with four months remaining in 2021. The other major indices, such as the Nasdaq and Dow Jones, are showing similar patterns as measured via QQQ and DIA, respectively.

Stocks are overbought and at extreme valuations, as measured by any historical metric (P/E ratio, Shiller P/E ratio, and Buffet Indicator). Valuations are stretched across the board, with the major averages at all-time highs and far away above pre-pandemic highs.
Markets
Figure 1 – Adopted from Buffet Indicator analysis via Current Market Valuation

When the Fed Taper and Inflation Hit

As the Consumer Price Index (CPI) continues to push higher in conjunction with better-than-expected employment numbers, the Federal Reserve may be compelled to finally not only entertain the idea of raising rates but implement a rate increase. Although interest rate risk disproportionally impacts fixed-income investments such as bonds and annuities, stocks will undoubtedly be impacted as well. This is especially true for highly leveraged companies such as tech and super-charged growth companies. Even the prospect of higher rates hit the Nasdaq in March for a sharp decline, albeit that decline was quickly erased. This is a case in point of how quickly the markets can turn negative with the hint of rising rates which may be exacerbated in an already very frothy market. Continue reading "Q4 Approaching: Markets In Rarified Air"

"OPEC, The Market and Oil Bulls Have Run Out of Runway" - Andy Hall

Robert Boslego - INO.com Contributor - Energies


Andy Hall has forsaken his bull oil market position. In an investment letter dated July 3rd, he wrote, “Whereas it once seemed positions could be held with an eye to a longer-term secular appreciation, that is no longer the case…. In short, OPEC, the market and oil bulls have run out of runway.”

Andy Hall
Source: Amanda Gordon/Bloomberg

Mr. Hall explained his reasoning this way:

“Hitherto, it had been our view that oil would trend higher as prices would need to rise to a level that would justify investment in more costly sources of supply than just the core areas of US shale. However, not only has the core shale oil resource grown significantly — above all in the prolific Permian Basin — but break-evens have dropped because of secular productivity gains outpacing cyclical cost increases, at least for now…. If the marginal cost of oil for the next 3 or 4 years is headed to the mid-$40 range, then OPEC’s attempts to push prices to $60 seem futile.” Continue reading ""OPEC, The Market and Oil Bulls Have Run Out of Runway" - Andy Hall"

Were The New Market Highs A Bull Trap?

On Tuesday we witnessed the S&P 500 and the DOW make new all-time highs. What is the significance of this? If you've been following my work and reading our comments then you're probably familiar with the 52-Week New Highs on Friday Rules which go like this:

Rule #1: On a new 52-week high, when the market closes at or close to its high on a Friday, buy and go home long for the weekend.

Rule #2: Exit the long position on the opening the following Tuesday.

Rule #3: If the market opens lower on Monday, exit this position immediately.

Since making their highs on Tuesday, the DOW and S&P 500 have been steadily moving lower and are in danger of closing lower for the week. Doing so would create a "negative engulfing line." A "negative engulfing line" or "bearish engulfing line," as it is some times called, is when the market price action engulfs the previous open and high period for the preceding week or day. If this turns out to be the case for the DOW and S&P 500 and this coming week they both close lower for the week, then the odds are pretty high that a top is more than likely in place. Continue reading "Were The New Market Highs A Bull Trap?"

Is S&P 500 Getting Ready to Skyrocket or Collapse?

There's no doubt about it, for the past four weeks the S&P 500 index has been trapped in a trading range.

In my new video I show you a key level to watch this week. If this level
is broken, it will be a game changer for this index.

As always our videos are free to view and there is no registration
requirement.

Enjoy the video and let us know what you think on our blog.

All the best,

Adam Hewison
President, INO.com
Co-creator, MarketClub

December Can Be A Tricky Month

Well here we are in the month of December and things can get pretty tricky this month. For this reason, I wanted to produce a video that I thought would be helpful to you during this time.

In my new video I show you the exact points that we’re looking at for a major trend change in the S&P 500. I also point out the exact number that will show an exit point, but not a major trend change, in this same index.

As always our videos are free to watch and there is no need to register and we look forward to your comments.

Adam Hewison

President, INO.com Co-creator, MarketClub