Precious Metals Sector Downside Target on Friday's Market Rout

Technical analyst Clive Maund assesses the precious metals landscape after Friday's broad market selloff, and offers strategies for precious metals investors.

After what happened on Friday, many Precious Metals sector investors are naturally concerned about the effect of further heavy losses in the broad market on the sector. Let's now review Friday's action, starting with the broad market itself, before moving on to consider the likely impact on the PM sector.

After almost two months of quietly drifting sideways, the ground opened up beneath the broad market on Friday, as we can see on the 6-month chart for the SP 500 index below. It gapped down at the open and plunged by 2.45%, heading ever lower as the day unfolded, there was not even the customary bounce in the last hour of trading. Continue reading "Precious Metals Sector Downside Target on Friday's Market Rout"

Signs Are Silver Bull Market Is Consolidating

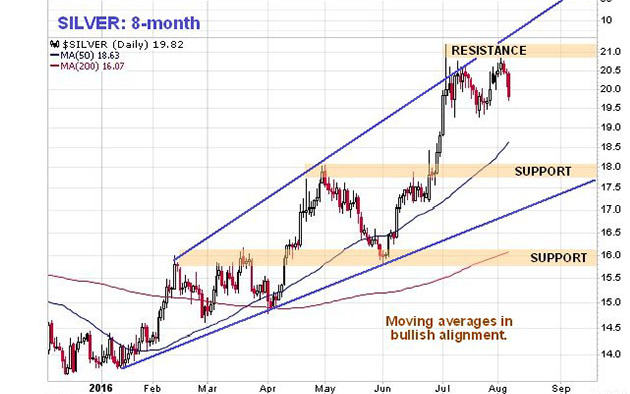
Having hit a target, silver has formed what is believed to be an intermediate top over the past five weeks or so, which it should soon start to descend from, says technical analyst Clive Maund.

Silver 8-month chart

On its three-month chart, we can see this presumed topping pattern started with the appearance of a prominent "Gravestone Doji" or "Shooting Star" candlestick early in July, with its negative implications being amplified by its having occurred on very high volume. While moving averages are in bullish alignment, the now yawning gap between the 50-day and 200-day makes a correction likely. After dipping back during August, the price rallied toward the highs early this month, and then failed, dropping hard on Friday, making it very likely that a Double Top is completing. Continue reading "Signs Are Silver Bull Market Is Consolidating"

Technical Analysis Toolkit for Energy Investors

The Energy Report: Energy prices are very sensitive to international events, especially conflicts in the Middle East. Do your charts factor in the periodic crises that impact oil and gas prices as buy and sell moments? How do you factor in inflation and interest rate movements into your calculations about which energy juniors look like good buys at any given time?

Clive Maund: The charts do factor in periodic crises that impact oil and gas prices as buy and sell moments, but often in a contrary way. The trick is to gauge when a crisis is at its moment of greatest tension, and while this is not at all easy, the charts can often be a great help in defining such a moment. I will give you an example using a recent call on CliveMaund.com, where the top in oil was pinpointed a day after its occurrence. Some readers may remember an old saying used on the London market many years ago, "Buy on a strike." This refers to a strike by labor, not an oil strike. The underlying psychology of this was that the time of maximum tension and uncertainty, which was when labor unions called the workers out on strike, was the best time to buy stocks, because they would have been falling in anticipation of this, and as tensions later eased as the situation headed to resolution, they would rise again. So it is with conflict and tension situations in the Middle East and their impact on the oil markets. Continue reading "Technical Analysis Toolkit for Energy Investors"