Copper Update: Compressed Spring Could Snap Back Hard

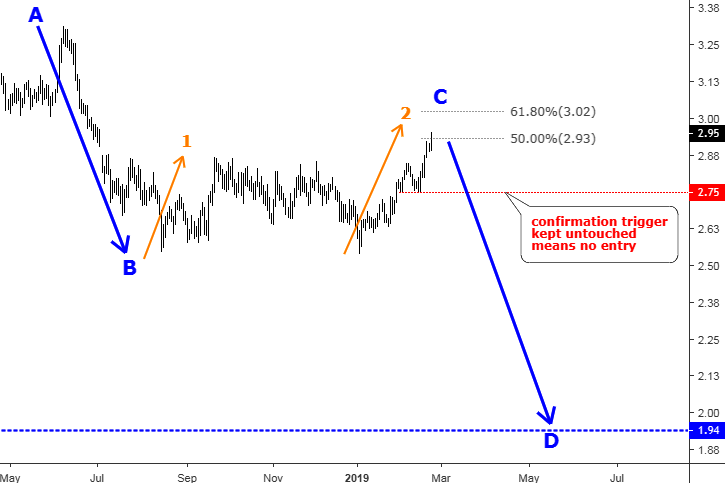
I’ve had a bearish outlook for copper for the past 2 years, starting with my post back in September 2017 when I had doubted the metal’s ability to sustain a long-term rally. Last July, we got the final confirmation of the trend reversal to the downside. And this past February I shared with you a promising trading opportunity, which had appeared in the copper market as the short-term upward correction invited the bears to sell the copper again around $3.

Indeed, copper has plummeted since then reaching the $2.48 low at the start of this month, but the following rapid bounce into the $2.70 area signaled a possible reversal ahead.

Let’s check the charts below to see if we can find some clues behind this worrisome price action.

I start with the weekly chart as I spotted a bullish pattern there already.
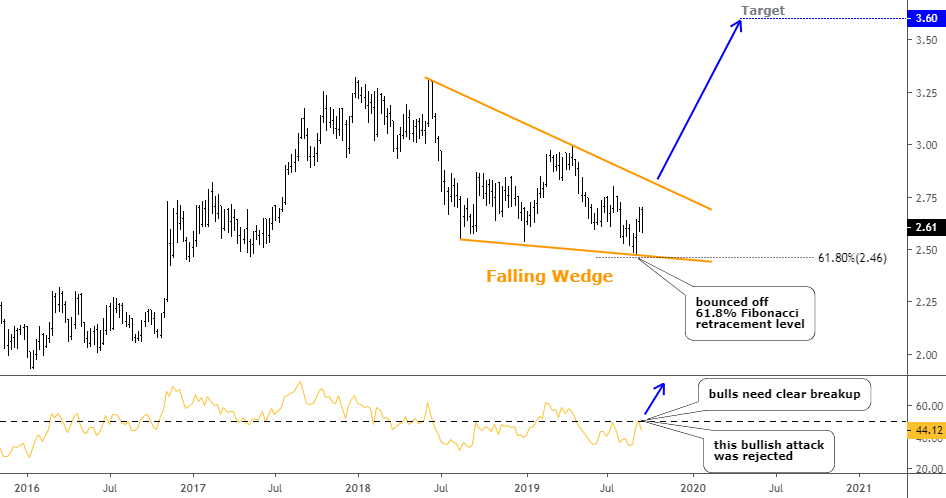
Weekly Cooper Chart
Chart courtesy of tradingview.com

As I said above the price printed the low of $2.48 and quickly reversed then. I added the Fibonacci retracement level of 61.8% to the chart, and you can see now that the price bounced right off it. In my February post, I applied AB/CD segments to set the target area for an anticipated drop and even used the extension ratio, where the CD is even larger than the AB segment. Continue reading "Copper Update: Compressed Spring Could Snap Back Hard"

Copper Trade: Stopped Out

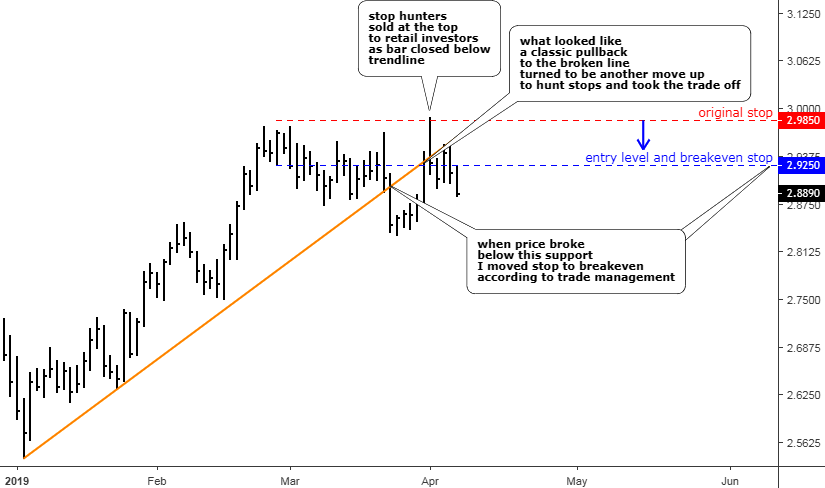
A month ago I got the short entry trigger in the copper futures. The idea started to emerge this February, and I was watching copper closely from that time and posted updates for you. And you witnessed how I moved entry triggers higher and higher until the price has finally pushed below the last one. And this was the true benefit of avoiding simple guessing to wait for the signal.

In the chart below I would like to show you how that trade was managed and what the outcome was.

Copper Futures Daily Chart: Walked Away Without A Scratch

price of copper
Chart courtesy of tradingview.com

The price of copper showed great volatility around the entry level (blue line) moving within a 10 cent range between $2.87 and $2.97. This happens due to a clash of opposite market forces at the extreme levels. Finally, the bears took the ball and pushed the price not only below the range but also below the crucial orange trendline support. Copper has hit the one month low at the $2.8345 on the 25th of March. At that stage, the short position had a profit of 3%, and I moved the stop to breakeven to enjoy the safe ride. This is a part of trade management as we should try to avoid risks as much as we can because we cannot control the market; we can only control ourselves and manage our risk. Continue reading "Copper Trade: Stopped Out"

Copper Triggered A Short Entry

So, dear traders, our patience was finally rewarded last week. Copper has provided us an even better opportunity as the price climbed higher to make a deeper retracement and the distance of the drop is now even greater. We started from the $2.75 level, then we moved higher to $2.885, but none of them were activated.

I spotted the famous reversal pattern on the chart, which adds to my structure analysis and I will show it in the chart below.

Let’s go through the trade setup steps again as the entry signal was triggered.

Step 1. Chart Analysis and Step 2. Trading Idea

These steps can be skipped as we already know what we are looking for.

Step 3. Trade Setup

We should prepare a Sell Setup to enter the trade using specific entry, stop and take profit levels. These are the things that make a trade. If you don’t have all three levels in your mind, you better avoid trading as it would become mere gambling. Continue reading "Copper Triggered A Short Entry"

Copper Update: This Is How I Would Trade This Sell Setup

Two weeks ago I put the spotlight on copper as I found there was a nice trading opportunity in the making. The trigger for the short trade was set at the $2.75 (below minor low) to avoid emotional trading or simple guessing, and it paid well as the price dipped from the $2.84 area and stopped 2/10 of the cent above the preset trigger. Then the price reversed much higher as I expected as it should retest the former top of $2.87 before it finally goes down.

We call it a trade setup. Before that, we had an idea, which was based on some kind of analysis. So, converting good ideas into profitable trades makes us better traders. Add patience, discipline and some sort of trading strategy to get consistent profits. Otherwise, a good idea could remain to be just a good idea without pleasant outcomes for us.

Let me show you in this post how I would trade this copper idea on the short side step by step.

Step 1. Chart Analysis: Copper Futures Daily,

Copper
Chart courtesy of tradingview.com
Continue reading "Copper Update: This Is How I Would Trade This Sell Setup"

Copper Gives Bears Another Chance

Last July I posted a monthly chart of copper futures to show you that the earlier move up had been completed when the price hit the accurately predicted $3.32 level and we have entered a bearish mode.

The big short game was set between the $3.32 and $1.94 extremes. The earlier post was calling for the price of copper to retest the former valley of $1.94. Below are the poll results with your expectations recorded in July of 2018. Again, I am very thankful for your stable activity!

Copper

The majority of you agreed with my opinion that the copper could revisit the former low of $1.94. 2018 finished at the $2.64 mark, which is far away from the target and below I will show you why and what could be the next for copper. Continue reading "Copper Gives Bears Another Chance"