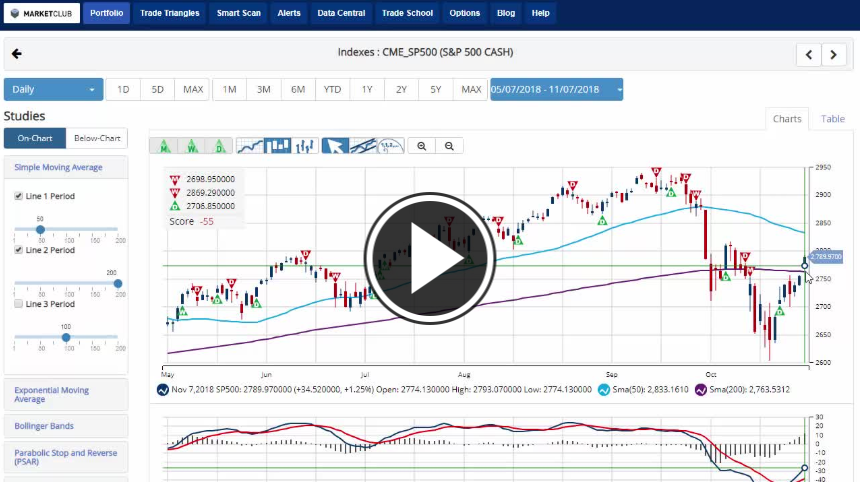
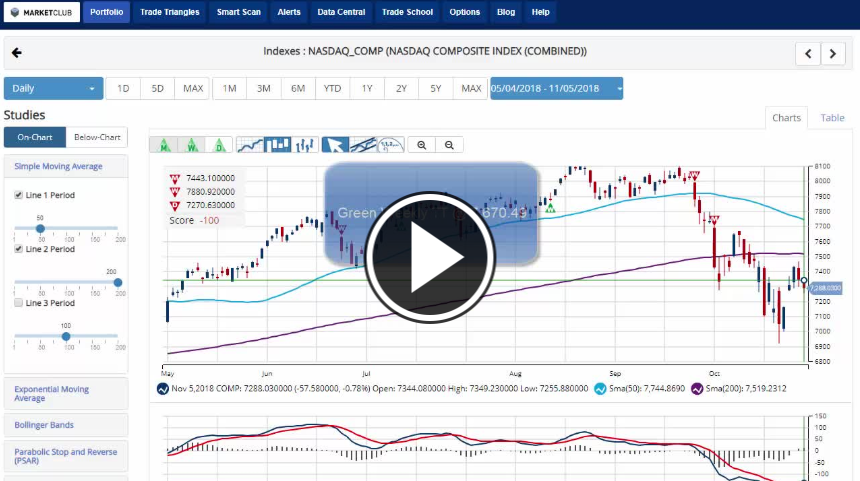
Hello traders everywhere. Stocks opened Friday trading higher for the most part but were unable to hang on to those gains as we headed into afternoon trading and after two weeks of gains the major indexes will post big weekly losses. All three indexes are looking at losses of over 2% with the DOW leading the way lower with a -2.6% weekly loss. The NASDAQ is in second place with a loss of -2.5% meanwhile the S&P 500 just checked in with a -2% loss.
For the first time in four weeks, the U.S. dollar will have a weekly loss of -.42%. The move lower came after Federal Reserve Vice Chairman Richard Clarida offered some dovish comments. Clarida told CNBC that central bank's pace of rate hikes wasn't too fast while also saying that the global economy showed signs of slowing. Overall the Chart Analysis Score is +55 with the recent weakness, but it's still on a long-term uptrend.
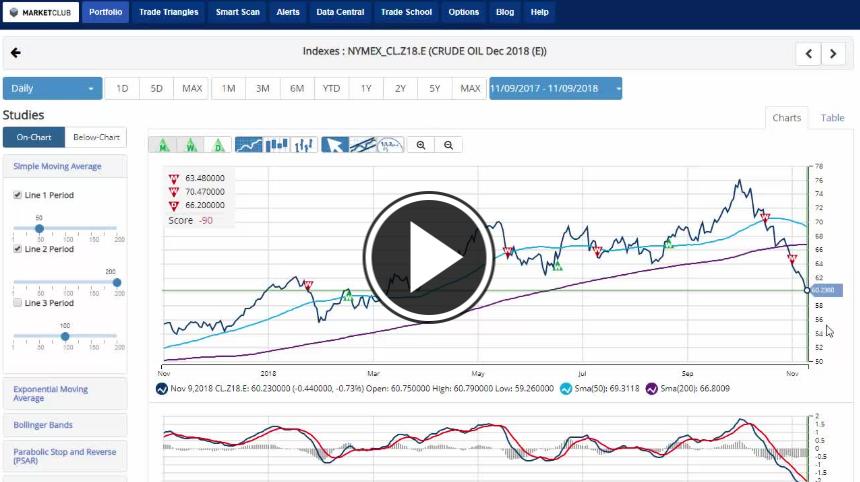
Crude Oil has stabilized at weeks end ending its historic slide six-week slide finding support at the $55 level. Oil looks to finish the week with three straight days of gains, but it will still post a big weekly loss of -5.2%. The Chart Analysis Score remains low at -90 indicating that the long-term downtrend still has considerable strength.
Much like oil, gold is looking to finish the week on a strong note with four straight days of gains trading back above the $1200 level and is the only instrument that we track that will post a weekly gain standing at +1% gaining back half of the last weeks -2% loss. Even with the recent daily strength, the Chart Analysis Score remains low at -75 telling you that the overall long-term trend is still strong.
Bitcoin suffered its most significant weekly loss in ten weeks standing to lose -12.8%. However, bitcoin has been and remains trapped in a tight trading just below its 50-day MA. The Chart Analysis Score of -90 tells you that the long-term downtrend is gaining strength and could head lower from here.
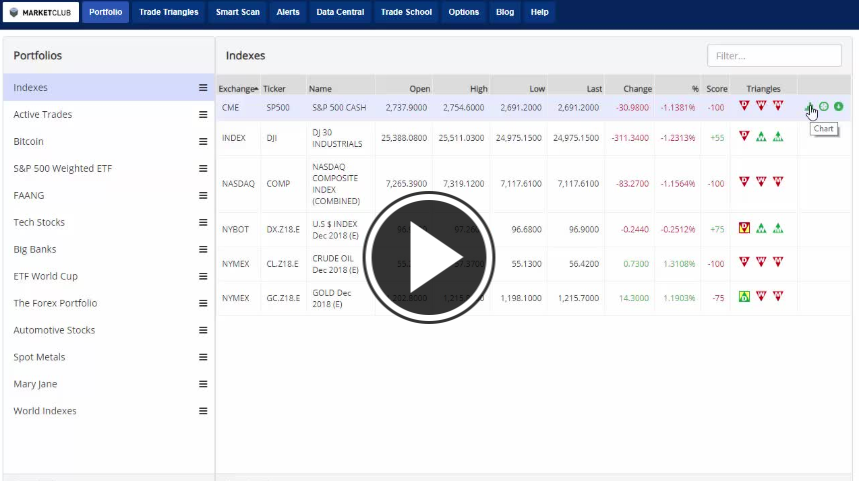
Key Levels To Watch Next Week:
Continue reading "Stock Market On Pace For Big Weekly Losses"