US Stock Markets Could Rally Beyond Expectations

Late Sunday afternoon, President Trump surprised the global markets with the announcement of increased trade tariffs with China relating to the ongoing trade negotiations and delayed trade talks between the two global superpowers. The global markets reacted immediately upon the open Sunday night (Asian open). The VIX short position puts quite a bit of professional traders at risk of big losses today while those of us that were prepared for an increase in volatility and price rotation is poised for some incredible opportunities.

The US stock market is set up for a price move that will likely make many people very wealthy while frustrating many others over the next few months. We’ve recently posted many articles regarding the 2020 US Presidential election cycle and the fear cycle that comes from these major political events. In November 2016, we remember watching Gold rally $60 early in the election night, then fall $100 as news began reporting the surprise winner. There is so much capital, and future capital expectations that ride on these election cycles – it can actually drive the markets in one direction or another.

Right now, we have two things we want to alert you to regarding our proprietary Fibonacci price modeling utility. First, the current trend is Bullish and the chance of a downside price move is still valid. Remember, one of the primary price rules within Fibonacci price theory is that price must ALWAYS attempt to seek out new highs and new lows – at all times. This means that once price establishes new price highs, any failure to continue establishing new price highs, through standard price rotation, will result in its price attempting to establish new price lows. Continue reading "US Stock Markets Could Rally Beyond Expectations"

How Close Are The Markets From Topping?

Now that most of the US Major Indexes have breached new all-time price highs, which we called over 5+ months ago, and many traders are starting to become concerned about how and where the markets may find resistance or begin to top, we are going to try to paint a very clear picture of the upside potential for the markets and why we believe volatility and price rotation may become a very big concern over the next few months. Our objective is to try to help you stay informed of pending market rotation and to alert you that we may be nearing a period within the US markets where increased volatility is very likely.

Longer term, many years into the future, our predictive modeling systems are suggesting this upside price swing is far from over. Our models suggest that price rotation will become a major factor over the next 12 to 15+ months – headed into the US Presidential election cycle of November 2020. Our models are suggesting that the second half of this year could present an incredible opportunity for skilled investors as price volatility/rotation provide bigger price swings. Additionally, our models suggest that early 2020 will provide even more opportunity for skilled traders who are able to understand the true price structure of the markets. Get ready, thing are about to get really interesting and if you are not following our research or a member of our services, you might want to think about joining soon.

We are focusing this research post on the NQ, ES and YM futures charts (Daily). We will include a longer-term YM chart near the end to highlight longer-term expectations. Let’s start with the NQ Daily chart. Continue reading "How Close Are The Markets From Topping?"

Oil Market Readies For Iran Sanction Waivers, Round 2

Crude oil production in Iran had reached 3.84 million barrels per day (mmbd) in the period following the lifting of sanctions by the Obama Administration. But following President Trump’s announcement in May 2018 that the U.S. would re-impose sanctions in November, demand for Iranian crude dropped to 3.7 mmbd by October. In November, the Trump Administration allowed limited waivers to the sanctions to eight countries, but Iranian production dropped by another 700,000 b/d by March.

The waivers were designed to terminate on May 2nd, but Secretary of State Mike Pompeo announced April 22nd that the waivers would not be extended. "This decision is intended to bring Iran's oil exports to zero, denying the regime its principal source of revenue," the White House said in a statement.

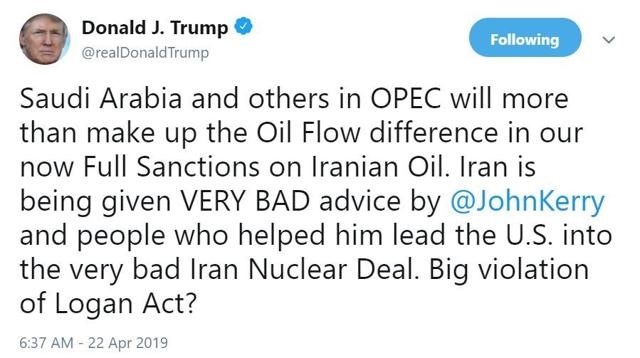
According to the International Energy Agency (IEA), Iran’s exports of crude and condensates are running about 1.1 mmbd in April. President Trump tweeted Saudi Arabia and others in OPEC had assured him that they would make up the impact of any decline in Iran’s exports:

Iran

In the months leading up to last November, KSA had increased its output to 11.1 mmbd, at the request of the White House, to ensure that oil supplies would be adequate once the Iranian sanctions took effect in November. But Trump’s granting of the waivers immediately created an oversupply in the global oil market, and oil prices collapsed as a result. Continue reading "Oil Market Readies For Iran Sanction Waivers, Round 2"

Financials Setting Up An Island Top Formation

As we continue to scan the charts for setups and trigger to alert our followers, we’ve come across a setup that may be more ominous than what it appears. Recently we’ve posted articles about how the SPY and the NQ have pushed into new all-time high price territory and how Gold is setting up for a momentum base that should launch precious metals to near highs. We’ve also discussed how we believe the current upside price bias in the US stock markets should last another 10~35+ days before new price weakness sets up – possibly pushing prices lower in late May or early June 2019.

Our research team has been scanning the charts looking for anything that could give us an edge to the potential setup for this price weakness in the future. We believe the Transportation Index and the Financials could be keys to understanding how far the upside rally can continue and when a price peak may begin to warn of a potential price top or rollover.

An Island Top is a pattern that sets up with an upside price gap followed by sideways price action above that gap. In theory, this type of setup should promote the gap to be filled with downside price action before any further upside price move can continue. Although, gaps to the upside are fairly common in strong uptrends. Given the strength of the earnings data released early this week and the expectations that we have for some continued upside price bias over the next 10~35+ days, we are watching these Island Top formation in the Financials for any signs of weakness to alert our followers. Continue reading "Financials Setting Up An Island Top Formation"

World Oil Supply And Price Outlook, April 2019

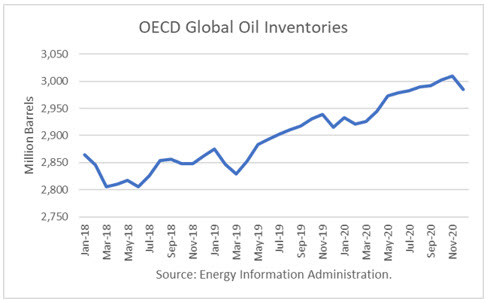
The Energy Information Administration released its Short-Term Energy Outlook for April, and it shows that OECD oil inventories likely bottomed last June at 2.806 billion barrels. It estimated stocks fell by 18 million barrels In March to 2.829 billion, 23 million barrels higher than a year ago.

However, throughout 2019, OECD inventories are expected to rise rather quickly through November. At year-end, EIA projects 2091 to be with 2.915 million barrels, 53 million more than at the end of 2018.

For 2020, EIA projects that stocks will build another 70 million barrels to end the year at 2.985 billion. That would push stocks into glut territory.

oecd oil inventories

Oil Price Implications

I updated my linear regression between OECD oil inventories and WTI crude oil prices for the period 2010 through 2018. As expected, there are periods where the price deviates greatly from the regression model. But overall, the model provides a reasonably high r-square result of 80 percent. Continue reading "World Oil Supply And Price Outlook, April 2019"