Today’s guest blogger comes from Gary of Biiwii.com, a site that provides top notch analysis and commentary on stocks, currencies, commodities and bonds. I'm a frequent reader of the blog and HIGHLY encourage you to check out Gary's site for more analysis.
===========================================================
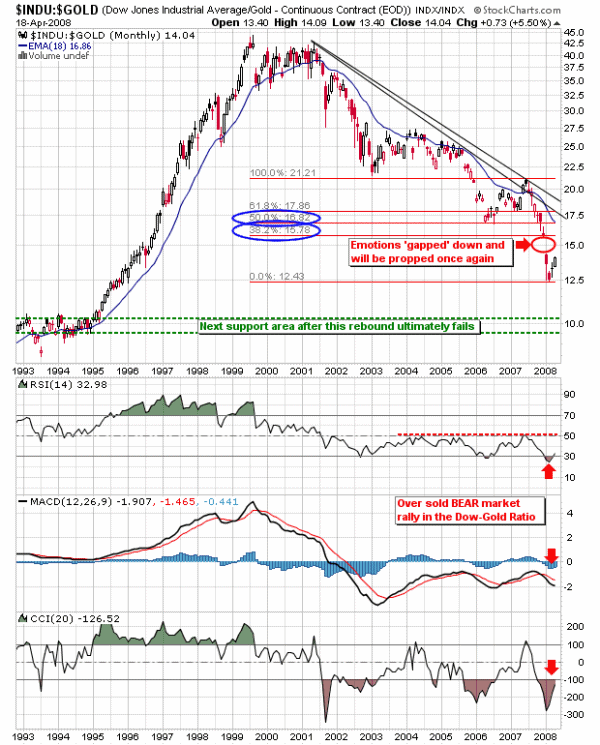
Long time readers of the Biiwii.com blog know that I rely on ratio charts to the max. In fact, I find these ratios between different markets to be absolutely vital to being on the right side of the trade where macro themes are concerned. A recent example is the Dow/Gold ratio, which allowed me to navigate the oncoming - and entirely predictable - rally in stocks (both in nominal terms and in 'real' terms as measured in gold) that began in the fear filled days of March. Our April Letter from the main website, Reset/Recalibrate explained the process by which market sentiment needed to be reset. Here is the monthly ratio chart that was used in the letter:
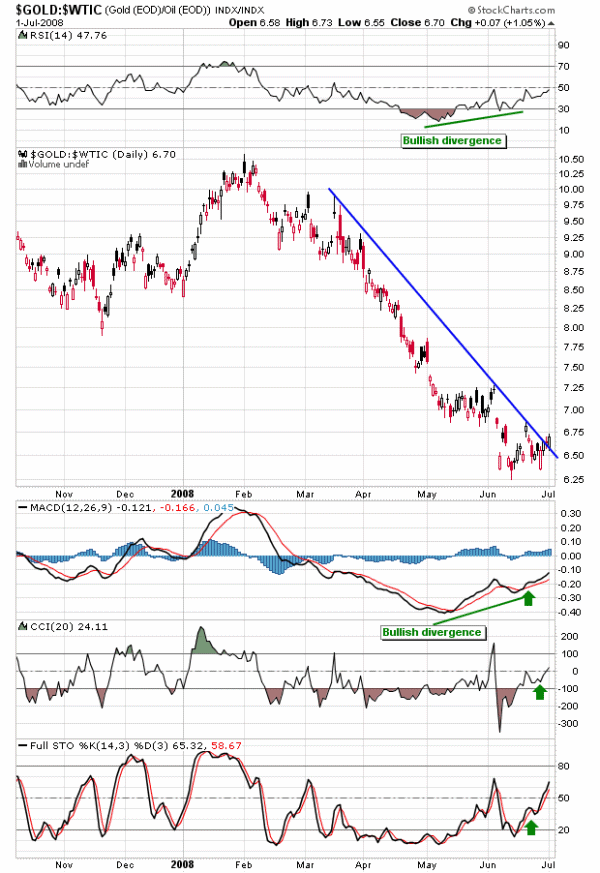
Of interest now is the Gold/Oil Ratio, which appears to be in the bottoming process amid bullish divergence by RSI & MACD. This is an absolutely vital ratio to gold stock traders as oil is a major cost input to mining operations and with the likelihood of the ratio bottoming, gold miners' bottom lines stand to benefit as their product (gold) begins to outperform one of their major cost drivers (oil). Here is a current daily chart showing the status of the ratio. Gold, while having been pummeled in oil terms recently (along with nearly everything else), may well turn up from here in terms of crude:
I also routinely use the Gold/Silver Ratio to gauge general market confidence or lack thereof, along with more traditional sentiment indicators like the VIX and Put/Call Ratios. Other ratios which have appeared on the blog have included the S&P500/Nikkei Ratio, NDX/Dow and even SOX/NDX. All provide hints as to sentiment and/or macro-fundamentals and hence future market direction.
To summarize, you can trade any market but it is very important to be aware of the major trends and turning points between different markets and assets classes so that you may be aware of whether or not you are on the right side of the trade in the bigger picture. As traders and investors, we need every edge we can get.
===========================================================
Read more Biiwii.com TA & Commentary by Gary at Biiwii.com

 Today we've asked Tony Edwards to share his favorite trade entry setups with our readers. Tony Edwards has been an active independent trader for nearly 20 years. He trades an extremely wide range of instruments with a special focus on YM, ES, 6E, CL and GC. He offers traders daily, unique support and resistance levels ("TraderSmarts Numbers") as well as Live Trade Alerts via www.tradersmarts.net.