World Oil Supply, Demand And Price Outlook, September 2018

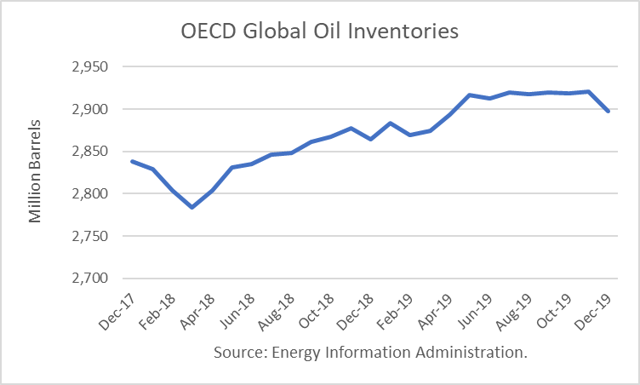
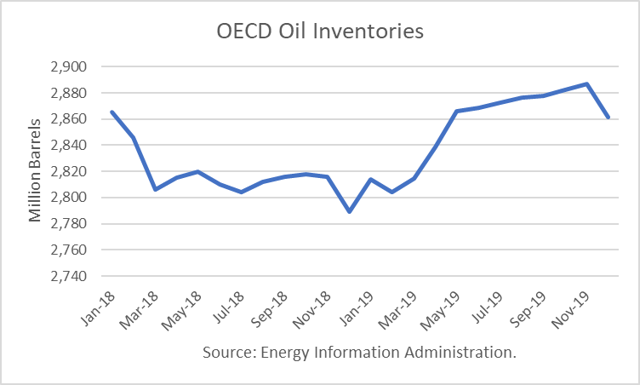
The Energy Information Administration released its Short-Term Energy Outlook for September, and it shows that OECD oil inventories likely bottomed in July at 2.804 billion barrels. It shows inventories rising in the third quarter, contrary to the usual seasonal trend. However, it forecasts that stocks will drop in December to 2.798 billion after the Iranian sanctions are expected to go into effect.

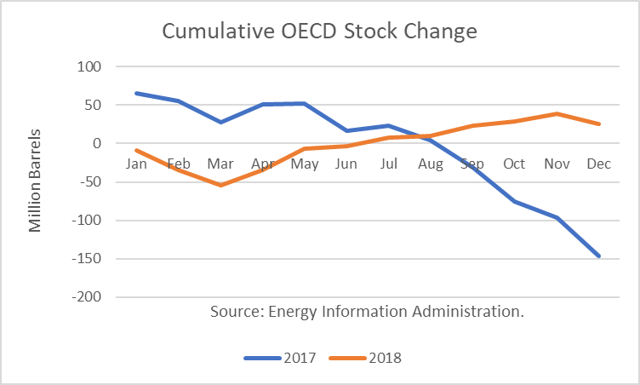
Throughout 2019, OECD inventories are generally expected to rise, ending the year with 72 million barrels more than at the end of 2017. The anticipated drop in Iranian production, due to the U.S. sanctions, is forecast to be offset by increases from other producers, such as the U.S., Canada and the Gulf states of Saudi Arabia, Kuwait and the UAE.

World Oil Supply

Saudi Arabia has recently stated that it can produce at least 12 million barrels per day. If it does increase output to that level, this would be a major “surprise” to world markets since its production has never exceeded 11 million. Continue reading "World Oil Supply, Demand And Price Outlook, September 2018"

U.S. Crude Production Growth Rebounds In June

The Energy Information Administration reported that June crude oil production averaged 10.674 million barrels per day (mmbd), up 231,000 b/d from May. The surge was partly on the back of a rebound of 154,000 b/d in the Gulf of Mexico (GOM) which had fallen due to unplanned maintenance. In addition, there was a surge of 165,000 b/d in Texas and a loss of 45,000 b/d in Alaska due to normal summer maintenance.

U.S. Crude Production Growth Rebounds

The EIA-914 Petroleum Supply Monthly (PSM) figure was 223,000 b/d lower than the weekly data reported by EIA in the Weekly Petroleum Supply Report (WPSR), averaged over the month, of 10.897 mmbd.

U.S. Crude Production Growth Rebounds

EIA has since kept weekly production estimates essentially flat, as it apparently waits for the monthly survey numbers to catch-up. Continue reading "U.S. Crude Production Growth Rebounds In June"

Permian Takeaway Capacity: From Constrained To Over-Supply by 2020

Oil-directed drilling rigs in the Permian Basin continue to rise and are at 485 for the week ending August 24th. This figure is 29 percent higher than a year ago.

Permian

The growth of crude production in the Permian Basin has been very impressive over the past year. Estimated output in September 2018 is expected to be 3.421 million barrels per day (mmbd), an increase of 850,000 b/d, or 33 percent, year-over-year. Continue reading "Permian Takeaway Capacity: From Constrained To Over-Supply by 2020"

Updated World Oil Forecast For April

Robert Boslego - INO.com Contributor - Energies - World Oil Forecast


According to the Energy Information Administration (EIA), world oil production will exceed demand for much of the balance of 2018, and therefore global OECD oil inventories are projected to rise. Specifically, the EIA estimates that OECD inventories bottomed at the end of March at 2.784 million barrels (mmb) and will rise by 80 mmb through year-end, up 26 mmb from December 2017. And its projections through 2019 show another net stock gain of 34 mmb to end the year at 2.898 mmb.

World Oil Forecast

The DOE forecasts for 2018 and 2019 are based on dramatically different seasonal stock changes that occurred in 2017. OECD stocks fell by over 147 mmb from August through December, according to the latest estimates. But in 2018, it is predicting a net stock build over those same months.

World Oil Forecast

In 2019, it is forecasting a build similar to 2018, but without a first-quarter draw. Continue reading "Updated World Oil Forecast For April"

Analysis Of The EIA Crude Oil Statistics

Robert Boslego - INO.com Contributor - Energies - Crude Oil Statistics


According to the Energy Information Administration (EIA), U.S. petroleum inventories (excluding SPR) fell by 6.9 million barrels (mmb) last week. They stand about 52 mmb lower than the rising, rolling 5-year average and are about 149 mmb lower than a year ago. However, comparing total inventories to the pre-glut average (end-2014), stocks are 127 mmb above that average.

Crude Oil Statistics

Commercial crude stocks fell by 2.6 mmb, and SPR stocks were unchanged last week. Gasoline stocks fell by 1.7 mmb, and distillate stocks fell 2.0 mmb. Primary demand dropped 256,000 b/d to average 20.675 million barrels per day (mmbd). Continue reading "Analysis Of The EIA Crude Oil Statistics"