How To Spot The End Of An Excess Phase - Part 2

In Part I of this research article, my research team and I highlighted the five unique components of an Excess Phase peak and breakdown process. We are sharing this data with you because we believe the US stock market has already meandered 2.5 years past the end of a US Stock Market Appreciation phase and is well into an Excess Phase Peaking process. This becomes very important for traders because risks are much higher in these late Excess Phase stages because volatility is usually 4x to 6x higher than previous phases. Additionally, psychologically, many traders want the rally to continue and deeply believe the end of this phase is “just a pullback in a bigger trend”. This can be very dangerous as traders sometimes continue to buy into deeper price corrections – leveraging their accounts to the hilt thinking “they are going to make a killing when the rally resumes”.

Exploring Past Excess Phase Peak/Breakdown Events

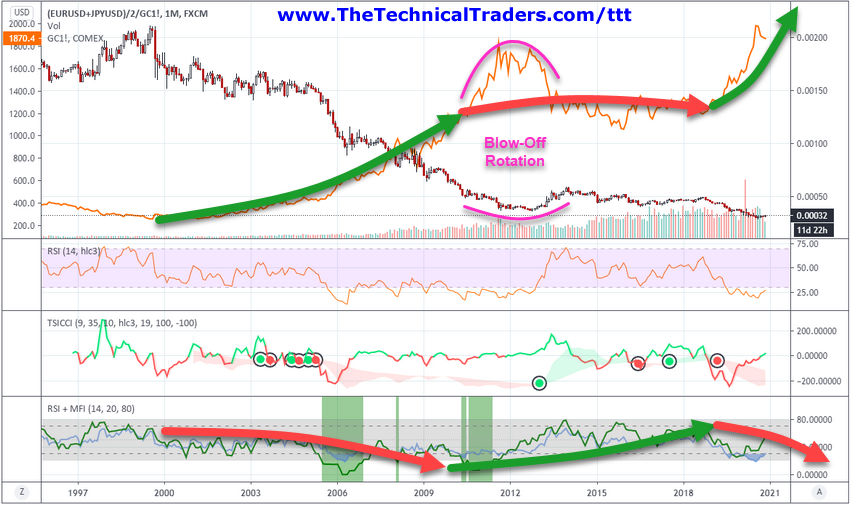
Excess Phases and Blow-Off Peaks/Bottoms can become very addictive for certain people – especially those that have gotten into the trend before the Excess Phase began. These people are often “die-hard” believers that the trend will never stop rallying and can sometimes leverage themselves into very dangerous positions.

If you recall from the first part of this research article, there are five phases to the Excess Phase price decline and we believe each of these five phases is fairly common for all excess phase breakdowns: Continue reading "How To Spot The End Of An Excess Phase - Part 2"

How To Spot The End Of An Excess Phase - Part 1

If you have been following my team’s research posts recently, we have highlighted some interesting new research related to Appreciation/Depreciation phases in the US stock market and how that relates to Gold. Today we will explore another method of identifying the different phases of market trends that appears to show very clear Appreciation/Depreciation phases and extended end-phase blow-off tops and bottoms.

My research team and I believe the current rally in the US stock markets represents an end-phase blow-off top after a 9.5-year Appreciation phase that began in mid-2009. We believe it is very important for traders to understand these larger Appreciation/Depreciation cycles and how the Blow-Off end phases often create extreme volatility and price rotation.

Below, we are using a custom EURUSD/JPYUSD index divided by GOLD as the base Candlestick chart and have applied the real Gold price levels on the chart for visual reference. Near the bottom of the chart, we are showing the RSI indicator, the TSICCI indicator, and the RSI + MFI Indicator that helps to highlight the broad market trends and cycle phases. We want you to pay attention to the GREEN and RED arrows we’ve drawn on this chart showing the Appreciation/Depreciation phases of Gold and the broader US stock markets in EUR/JPY currency form. This method of charting these phases takes a bit of patience and understanding. We are looking for correlations to US stock market trends in relation to precious metals, and we must consider the end-phase process.

Excess Phase

The end-phase process, after any appreciation or depreciation phase, often includes a very volatile “blow-off” period where trends continue beyond the end of the actual price phase. This happens because the momentum of the previous price move has yet to realize the transitional shift in underlying appreciation/depreciation factors. Traders still want the rally in the stock market or metals to continue, so they chase after the excess phase rally until the momentum of the move fails. Continue reading "How To Spot The End Of An Excess Phase - Part 1"