Gold Could Fly Over A Helicopter Throwing Money

On the 16th of March, when I wondered if “That’s It?” for gold it dropped for more than $100 to the low of $1451. It looked like the first move down in the large second leg of a huge complex correction.
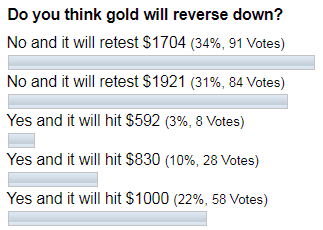
As we know, guessing tops and bottoms is a tricky exercise. So, the next move up was considered to be a correction as to confirm the top we should see the passing move down first (checked), then there should be a corrective move in the opposite (upside) direction and the next should be the continuation to the downside. Let’s see below if you thought gold would reverse down.

The majority of you remained bullish as you clicked on the “retest of $1704” and “$1921”. The first bet already paid well as the market retested the former top last Monday. This price move was quite sharp as previously the same distance unfolded by gold within only 82 daily bars from November 2019 till March 2020 compared to only 20 daily bars this time.

It looks like gold doesn’t want to drop as things changed dramatically. Continue reading "Gold Could Fly Over A Helicopter Throwing Money"

Why Inflation?

The simple answer is that is what they are doing, inflating.

The slightly less simple answer is that they inflated in 2001 and it worked (for gold, silver, commodities and eventually stocks, roughly in that order). It also worked in 2008-2009 (for gold, silver, commodities and eventually stocks, roughly in that order).

The more complicated answer is that we are down a rabbit hole of debt and the hole appears bottomless. What’s a few more trillion on top of un-payable trillions? As long as confidence remains intact in our monetary and fiscal authorities – and COVID-19 or no COVID-19, stock mini-crash or not, confidence to my eye is intact, speaking of my country, anyway – they will inflate, and what’s more, they will be called upon to inflate.

Confidence may be failing in other parts of the world but the average American is behind this thing they don’t even really understand, known as the Fed. The average American expects the bailout checks from the fiscally reflating government too. Angst, of which there has been plenty lately, is much different from lack of confidence.

I can’t include here all the ways and means the Fed has (frankly, I don’t know about them all) to prop the system, but if you go to the St. Louis Fed website you will find a whole slew of Keynesian egghead stuff. They are on it! Continue reading "Why Inflation?"

Gold Update: That's It?

It’s really amazing to see how some people take a selfie every day from childhood and then compile a video from those photos to see the timeline of their life.

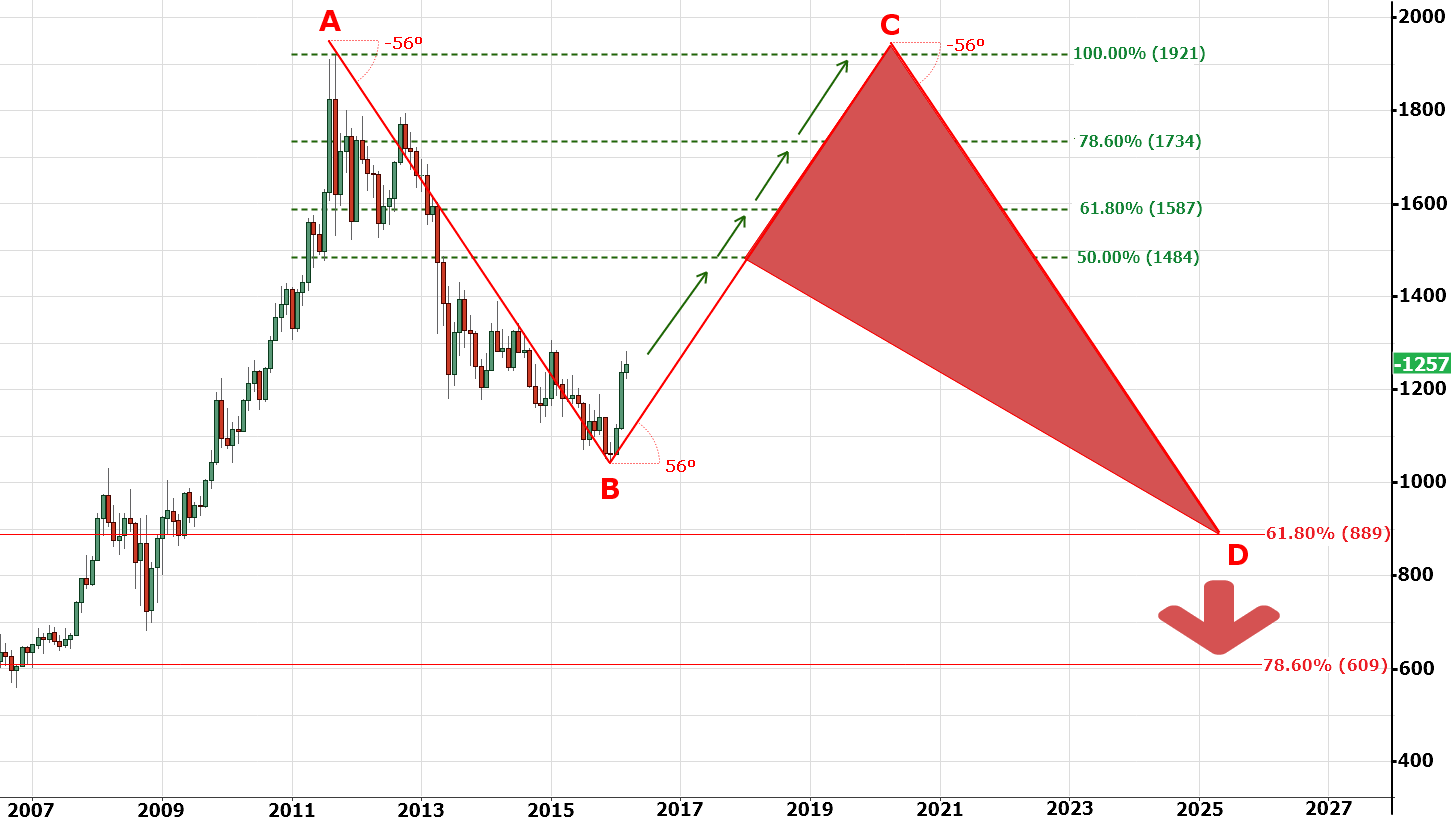
As gold reached all preset targets, hitting a new seven-year maximum of $1704, I think it’s an excellent time to contemplate the history of this large move up. I put the charts from the previous posts one by one to restore the timeline with my comments for you. Let’s start the time machine!

Chart 1. Global Monthly Chart Of 2016

Gold
Chart courtesy of tradingview.com

Four years ago, when the “Bulls Finally Took The Ball”, I posted a big map to share with you my view about a possible sizeable complex correction for gold to warn you of a time-consuming zigzag move. It was meant to become a real roller coaster with a big up and down move. It consists of two Fibonacci retracement areas. Green colored was set for the current move up. We almost reached 78.6% last week as price grew by $447 or 36% since that post in 2016. Continue reading "Gold Update: That's It?"

Gold Hits Target And Seven Year High

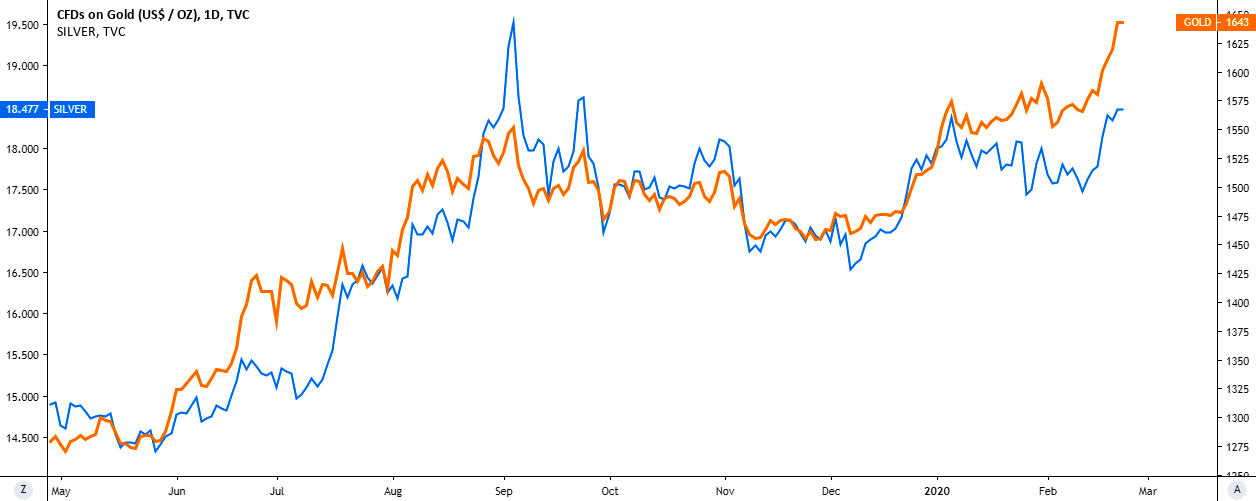
Before we start analyzing gold, let’s see how two precious metals behave in comparison on the chart below.

Gold
Chart courtesy of tradingview.com Gold (orange, right scale), Silver (blue, left scale)

This chart above starts from the bottom area of 2019. The most of the time, the yellow metal leads the game as Silver follows suit showing sharp moves to catch up with the gold. Sometimes the laggard throws over the leading trend amid excessive market reaction to the big moves of the top metal. Such extremes are rare and quickly get normalized by market “whales.” From this perspective, there is nothing new we can find on the chart. Continue reading "Gold Hits Target And Seven Year High"

Gold Hits Second Target

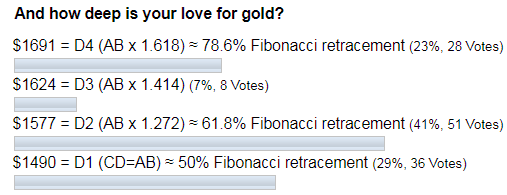
On the 6th of January, gold had hit the second target of $1577 that I showed you last June when we measured the depth of gold bugs love. I will update the big chart for you below to show why this second target is crucial. By the way, this target was the most favored then as you can see in the graph of ballots below.

gold poll

It’s a real miracle that we witnessed the Santa Claus Rally again this year. I updated the short-term chart for gold right ahead of Christmas as I thought the correction would extend itself to delay the rally for a later period. The invalidation point for the bearish scenario was set at $1516 as the price moved almost $100 above that point for someone’s benefit.

gold poll

Most of you voted for the immediate rally as you didn’t expect another drop, and you were amazingly right, again!

I think it’s time to check big charts to adjust our short-term navigation plans. Continue reading "Gold Hits Second Target"