Familiar Pattern in the AMD Chart

The Fed’s tightening puts hard pressure on the broad stock market and chip makers are not the exception. The strong labor market statistics and ongoing inflation pressure supports the hawkish mode.

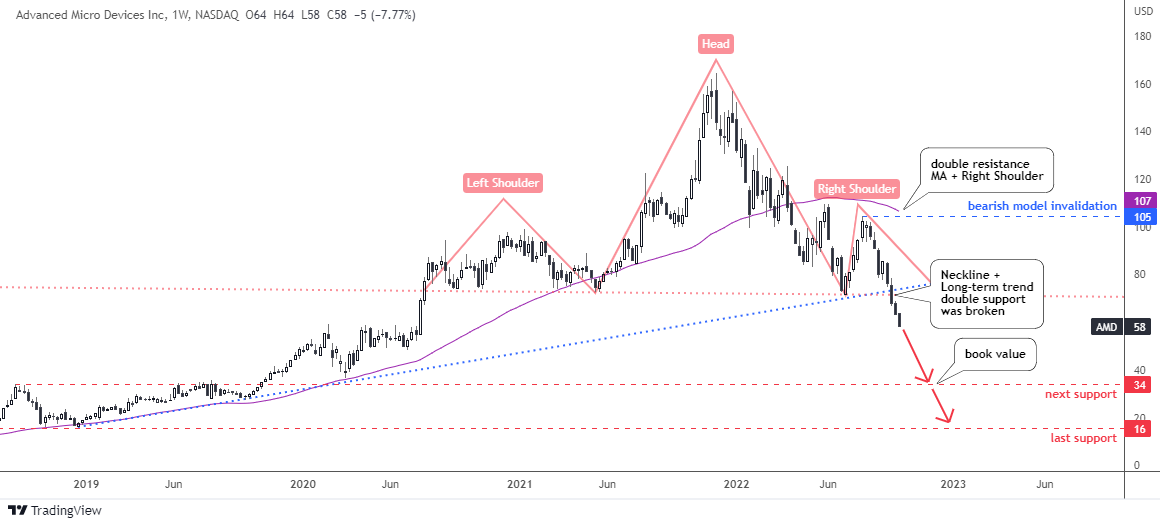
If one thinks that the sell-off might be over, there is a chart below that I spotted a disastrous model for a well-known chip maker Advanced Micro Devices, Inc. (NASDAQ:AMD).

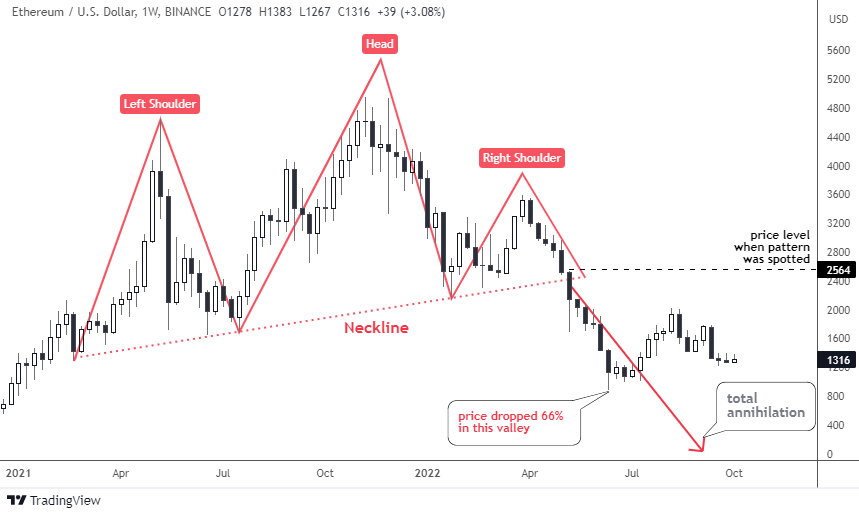
You definitely know this chart pattern I spotted for you. It is a Head & Shoulders reversal model. Last time this notorious chart pattern appeared in my posts was in May on the chart of Ethereum cryptocurrency. I updated it for you below to illustrate the historical sample.

ETH Weekly Updated

Source: TradingView

As soon as the price crossed below the Neckline beneath $2,400, Ethereum collapsed as it had lost a tremendous 66% down in the valley of $884 in June from the post level of $2,564.

This is how this model has played out before and that is what we could expect in the next chart of AMD below.

AMD Weekly

Source: TradingView

The Head & Shoulders pattern (pink) here is more balanced compared to up-sloped model in the Ethereum chart. The Neckline touch points are located almost exactly at the same level of $72, hence it is a flat line. The Head is quite tall above the wide Left Shoulder and the narrow Right Shoulder. The top of a latter offers a strong resistance and the invalidation point. Continue reading "Familiar Pattern in the AMD Chart"

Copper On Big Time Frame Charts: $0.6 or $6?

There is an age-old question asking: How do you determine if a trader is biased? Show him a chart and ask where he thinks the market would go and then show him the same, but reversed chart and if the answer is the same, then this trader is indeed biased. We call such a trader a Perma-Bull or a Perma-Bear. The market sentiment is often split even as there are a lot of biased traders and market is then trapped within a range as there is no dominant opinion among the participants.

Every day I see how the trading community spreads opposite signals in any instrument creating an overwhelming sea of information where it’s hard for novice traders to focus and make a trading decision. Different levels of experience and fantasy generate the diversity of chart patterns and models. People change time frames and squeeze or expand charts; all of this affects the perception and therefore, the final decision.

Let’s perform an educational experiment with two patterns that I found on different time frames for the same instrument, copper. I will add two separate charts with those patterns followed by explanations. I am eager to see what you think about the outlook for this instrument after reading and voting on the pole at the end of the article. Continue reading "Copper On Big Time Frame Charts: $0.6 or $6?"

Chart For Profit: Buy Gold, Sell Euro

Aibek Burabayev - INO.com Contributor - Metals


Dear INO.com readers,

This week I prepared for you an analysis of gold versus the euro and why it might be profitable choice.

My last post was also dedicated to the European cross of gold versus the Swedish krona and, for the time being, it managed to gain more than 200 SEK per troy ounce (already or more than 2%). The target is set for a 14% gain, so please be patient.

Today I am going to tell you about a chance to score a nice 18%. The chart above is a monthly candle graph of XAUEUR for the last 5 years. It was me who wrongly forgot about such a liquid metal cross with such an interesting chart pattern being shaped. But fortunately, today we still have a chance to buy gold versus euro. Continue reading "Chart For Profit: Buy Gold, Sell Euro"