Did This Formation Just Indicate That A Fed Rate Hike Is Ahead

Hello MarketClub members everywhere. According to St. Louis Fed Pres. Bullard (voter) December seems to be a "reasonable time" to raise interest rates. My guess is that the Fed will do zero and hope to hold off raising interest rates until 2017. The reason I say that is that it would more than likely hurt the Christmas shopping season and that is something the Fed is loath to do.

MarketClub's Mid-day Market Report

Now let me say this, I'm not a fan of the Fed and I think they've handled things very poorly and have done nothing to spur or help the economy. I do however believe that when interest begin to move higher, it will be an incentive for people to go out and begin buying things and looking at real estate again before rates get out of their price range. In other words, I think it will have the opposite effect of not dulling the economy, but spurring the economy to greater productivity. Continue reading "Did This Formation Just Indicate That A Fed Rate Hike Is Ahead"

Candlestick Patterns – Kicking

If you follow our blog, then you are definitely familiar with trader Larry Levin, President of Trading Advantage LLC. We have gotten such a great response from some of his past posts that he has agreed to share one more of his favorite trading tips as a special treat to our viewers. Determining the direction of the market can be tricky and just plain confusing at times, but Larry’s expert opinion keeps it simple and straight-to-the-point.

If you like this article, Larry’s also agreed to give you free access to his award winning book.

I think it's time for another look at Japanese candlestick analysis. Let's take a closer look at kicking, widely considered a high reliability pattern in candlestick charts.

Kicking patterns are another reversal signal.

Kicking patterns on a candlestick chart are formed when there are two marubozu - one white and one black - with a gap between them. Bullish kicking patterns would present as a black or filled candlestick without any wicks (shadows) followed by a gap higher with a white or hollow candlestick that is also without wicks. These are marubozu. They are formed when the market has a particularly one-sided trading session that closes at the high or low leaving just that real body of the candlestick. Continue reading "Candlestick Patterns – Kicking"

Candlestick Patterns – Kicking

If you follow our blog, then you are definitely familiar with trader Larry Levin, President of Trading Advantage LLC. We have gotten such a great response from some of his past posts that he has agreed to share one more of his favorite trading tips as a special treat to our viewers. Determining the direction of the market can be tricky and just plain confusing at times, but Larry’s expert opinion keeps it simple and straight-to-the-point.

If you like this article, Larry’s also agreed to give you free access to his weekly trading tip.

I think it's time for another look at Japanese candlestick analysis. Let's take a closer look at kicking, widely considered a high reliability pattern in candlestick charts.

Kicking patterns are another reversal signal.

Kicking patterns on a candlestick chart are formed when there are two marubozu - one white and one black - with a gap between them. Bullish kicking patterns would present as a black or filled candlestick without any wicks (shadows) followed by a gap higher with a white or hollow candlestick that is also without wicks. These are marubozu. They are formed when the market has a particularly one-sided trading session that closes at the high or low leaving just that real body of the candlestick. Continue reading "Candlestick Patterns – Kicking"

Understanding Candlestick Patterns - Kicking

If you follow our blog, then you are definitely familiar with trader Larry Levin, President of Trading Advantage LLC. We have gotten such a great response from some of his past posts that he has agreed to share one more of his favorite trading tips as a special treat to our viewers. Determining the direction of the market can be tricky and just plain confusing at times, but Larry’s expert opinion keeps it simple and straight-to-the-point. If you like this article, Larry’s also agreed to give you free access to one of his top trading secrets.

I think it's time for another look at Japanese candlestick analysis. Let's take a closer look at kicking, widely considered a high reliability pattern in candlestick charts. Continue reading "Understanding Candlestick Patterns - Kicking"

Traders Toolbox: Candlestick Formations Revisited...

Trader's Toolbox

At MarketClub our mission is to help you become a better trader. Our passion is creating superior trading tools to help you achieve your goals -- no matter which way the markets move -- with objective and unbiased recommendations not available from brokers.

The Trader's Toolbox posts are just another free resource from MarketClub.

---

"Japanese candlesticks, which have been enjoying the spotlight in recent years, are difficult to explain in oneCandlestick Chart 
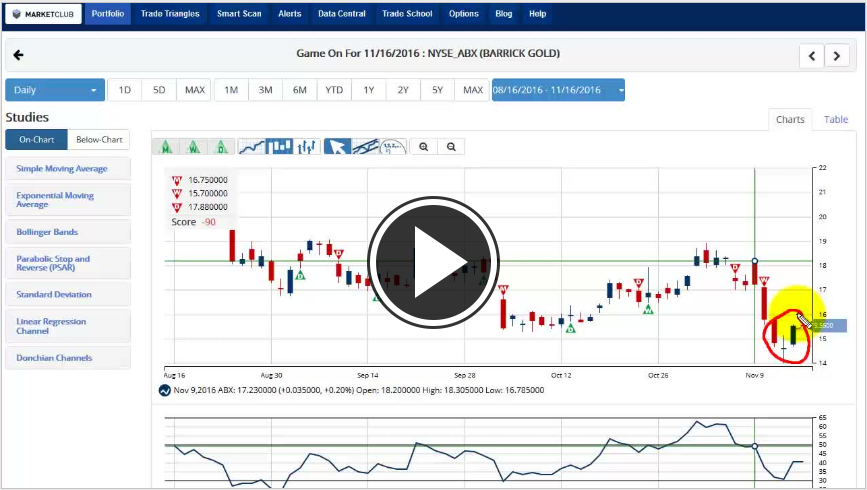
broad brush. Candlesticks draw on the same open-high-low-close data as do bars. Here the length of the bar, or “candle,” is determined by the high and low, but the area between the open and close is considered the most important.This area, the “body” of the candle, is filled with blue (or white for most charting programs) for closes higher than open, and is filled with red (or black from most charting programs) for down days. The wicks above and below constitute the “shadow” of the candle, or high or low.

No pattern is 100% correct, but these formations are often time incorporated into many mechanical systems and can provide as great information source for the naked eye...."

Revisit the Trader's Toolbox Post: "Candlestick Formations" here.