Like Clockwork, Freeport-McMoRan (FCX)

One of the many benefits of MarketClub is having a great network of traders who use our service and share their ideas. This particular stock idea came from Harold, who has been a member of MarketClub for several years. Harold shared his stock idea with other members of our Member Blog yesterday.

This morning, I decided to take a look at Harold's stock idea, Freeport-McMoRan (NYSE:FCX). What immediately caught my attention was the rhythmic nature of this stock and how it almost performed like clockwork.
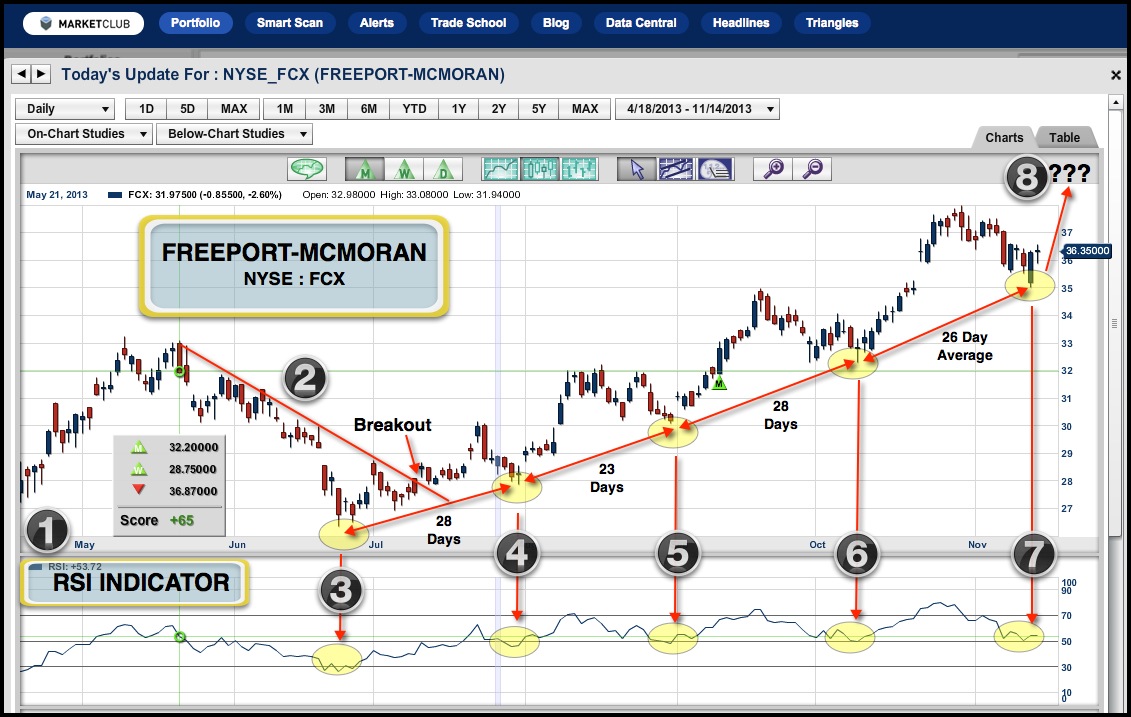
1. RSI indicator
2. Downtrend line and breakout
3. Major low established after trend line breakout
4. First cyclic low, 28 days after major low
5. Second cyclic low, 23 days after previous low
6. Third cyclic low, 28 days after previous low
7. Potential fourth cyclic low, 26 days after previous low
8. Potential upside target $40 Continue reading "Like Clockwork, Freeport-McMoRan (FCX)"

Traders Toolbox: Relative Strength Index Revisited...

Trader's Toolbox

At MarketClub our mission is to help you become a better trader. Our passion is creating superior trading tools to help you achieve your goals -- no matter which way the markets move -- with objective and unbiased recommendations not available from brokers.

The Trader's Toolbox posts are just another free resource from MarketClub.

---

"MarketClub is known for our “Trade Triangle” technology. However, if you have used other technical analysis indicators previously, you can use a combination of the studies and other techniques in conjunction with the “Trade Triangles” to further confirm trends.Developed by Welles Wilder, the Relative Strength Index (RSI) addresses the two major flaws of momentum – the need to have a constant band against which to compare price movement and the ability to smooth the ebb and flow of price movement.

Sharp up or down movement 10 days ago (in the case of a 10-day momentum line) can cause pronounced shifts in the momentum line even if the current prices are relatively stable, giving false signals. Also, different commodities may have different “overbought” and “oversold” levels. RSI corrects these concerns by smoothing the movement and by creating a constant range from 0 to 100...."

Revisit the Trader's Toolbox Post: "Relative Strength Index" here.