Gold Bounces But Couldn't Hold Friday's Highs

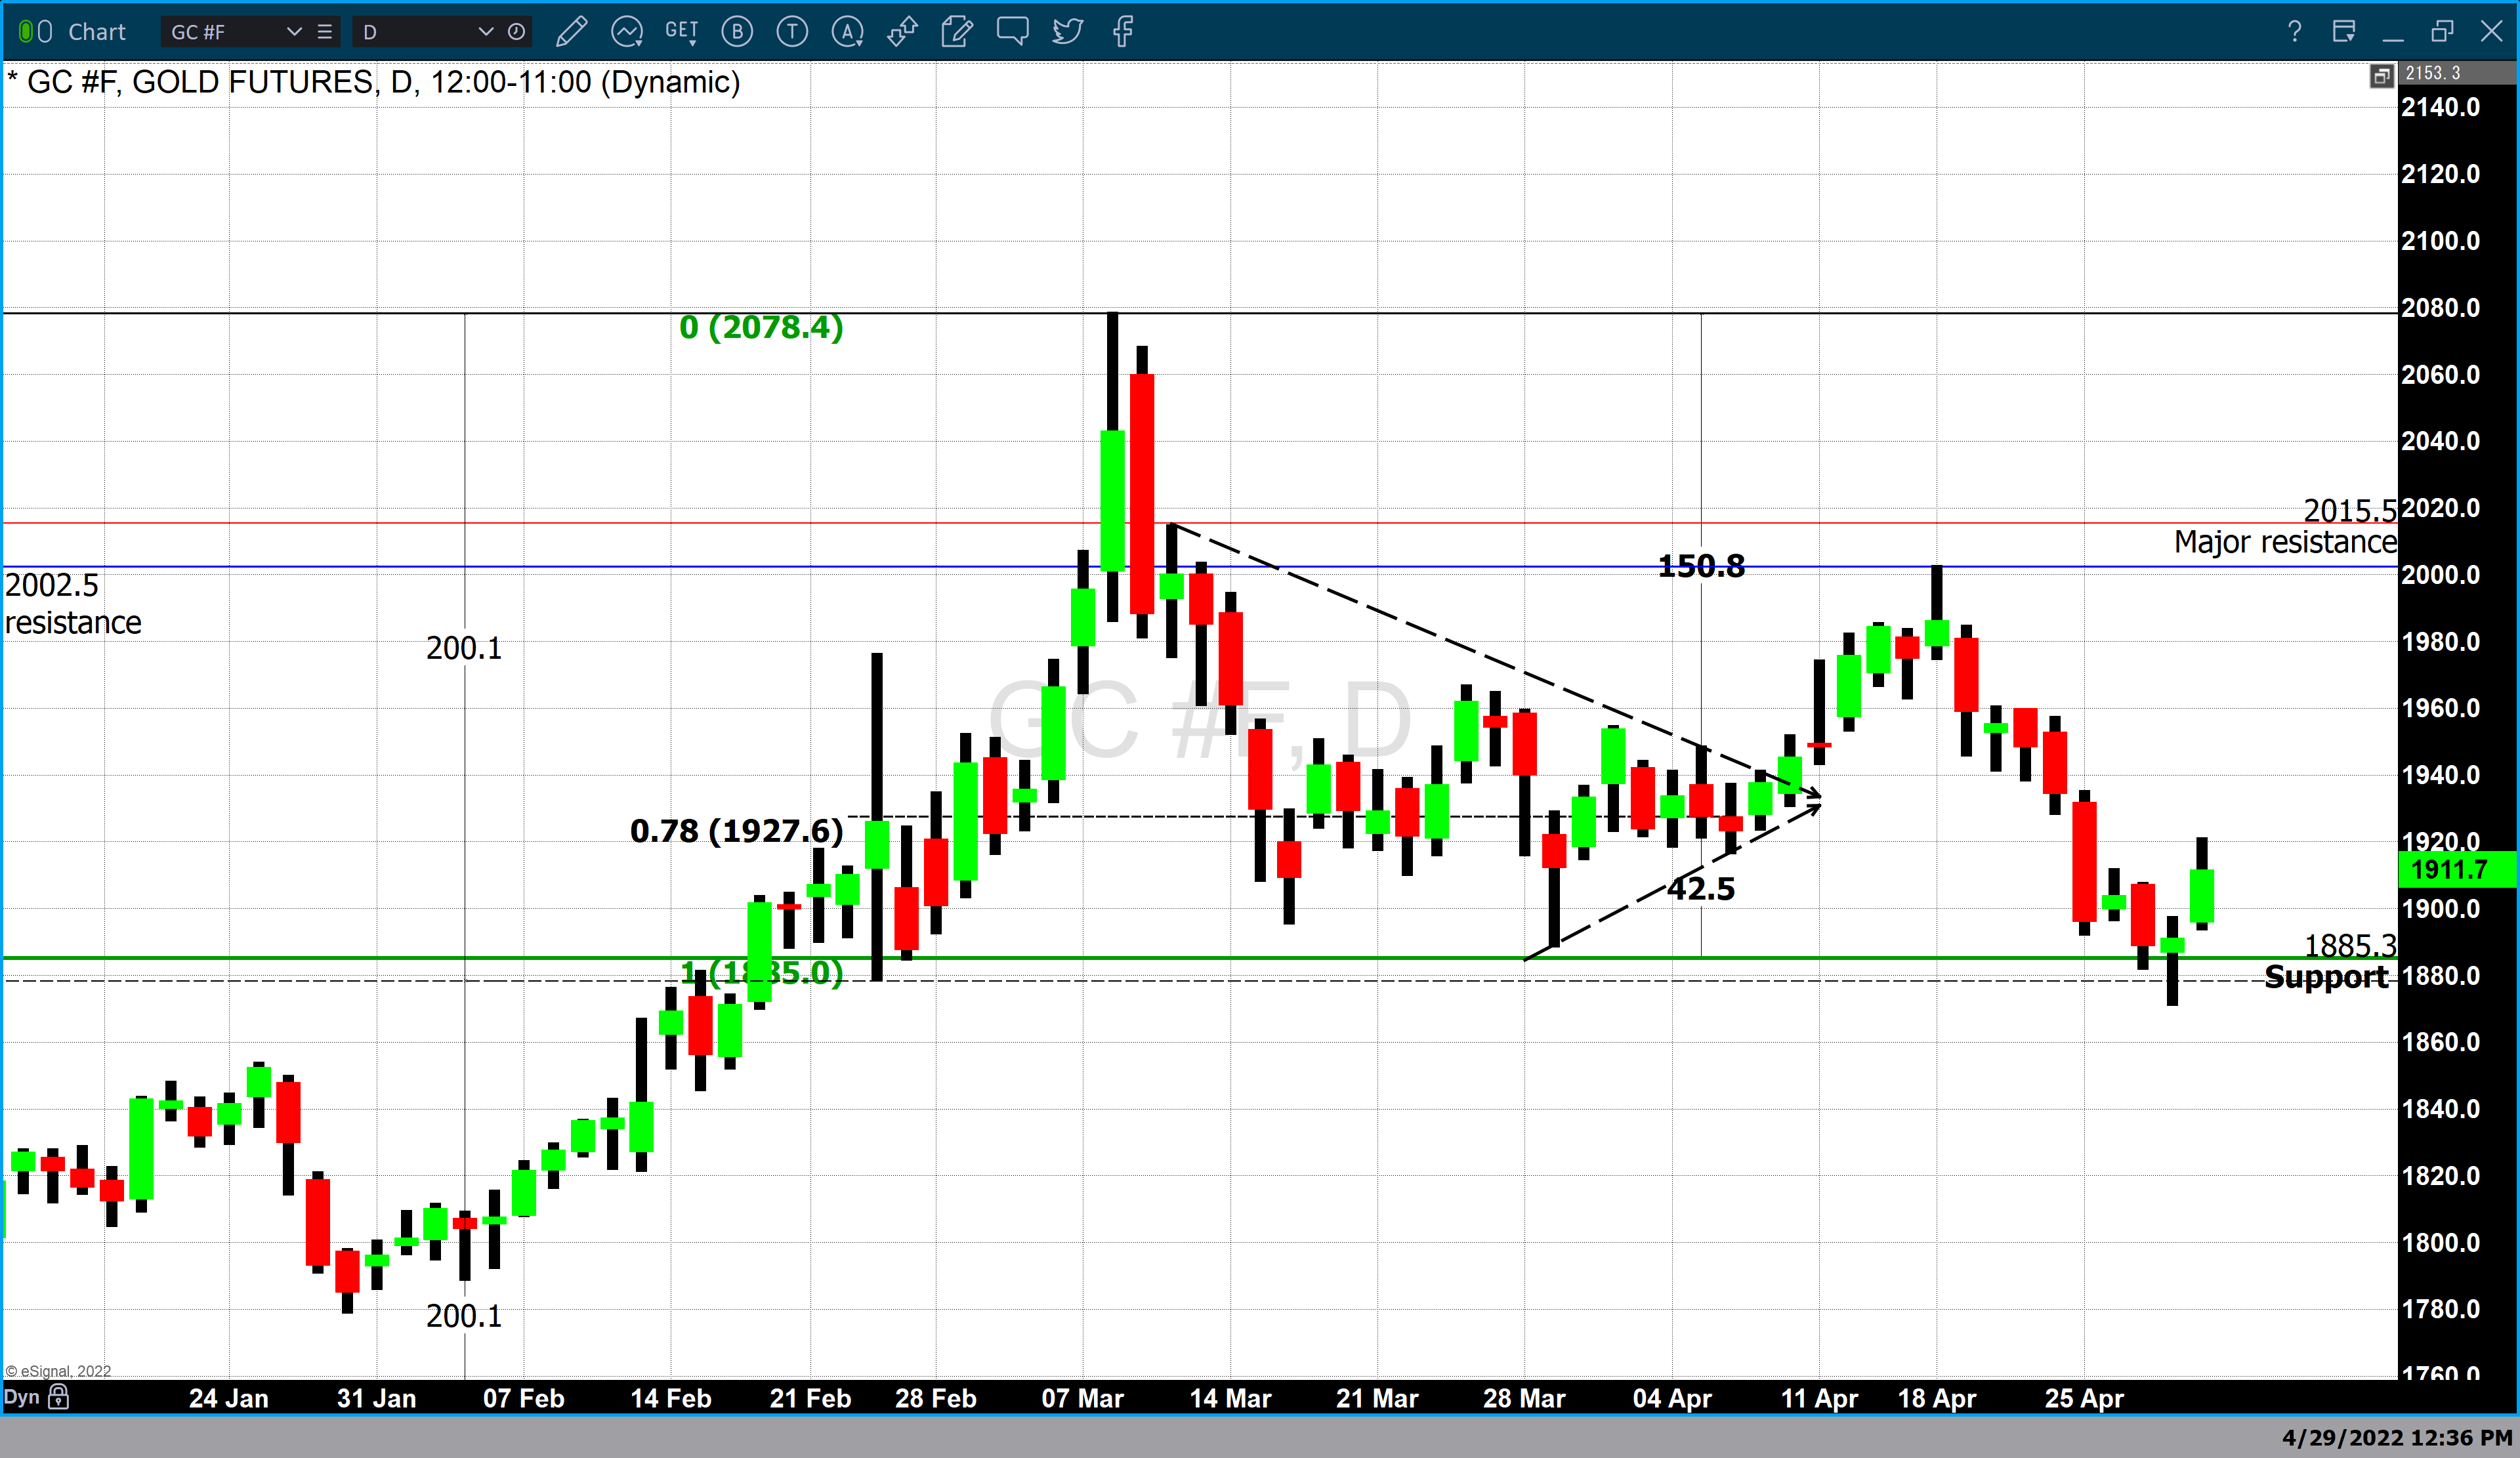
June 2022 gold futures opened Friday morning at $1895.80, far above Thursday’s low of $1871. Trading to a high of $1921.30 and settled in New York up 1.1% at $1911.70. However, on Fridays, Globex trading remains open until 6 PM EDT before closing for the weekend. As of 5:10 EDT, gold has moved back below $1900 and is currently fixed at $1896.90, a net gain of $5.60 or 0.30% in after-hours trading.

Gold Futures Daily Chart

The tremendous price swings evident in gold over the last couple of days likely resulted from multiple factors influencing gold prices. Investors continue to focus on next week’s FOMC meeting. It is widely anticipated that the Fed will enact a .50 percent interest rate hike which will go into effect at the end of next week’s meeting. Concurrently it is widely believed that the Federal Reserve will begin to reduce its balance sheet assets over the next three years. Economists polled by Bloomberg news believe that the Federal Reserve will reduce its balance sheet from the current level of $8.8 trillion to $6.4 trillion by the conclusion of 2024. Continue reading "Gold Bounces But Couldn't Hold Friday's Highs"

Let's Get Serious

Federal Reserve Chair Jerome Powell indicated strongly last week that the Fed will likely raise interest rates by 50 basis points at its next meeting on May 3-4. It will likely get more aggressive in its fight against 8%-plus inflation. It’s going to have to because just as fast as the Fed is trying to bail water out of the boat, the White House and Congress are determined to keep pouring it in.

“It is appropriate in my view to be moving a little more quickly” to raise rates than the Fed has recently, Powell said last Thursday at an International Monetary Fund event. “Fifty basis points will be on the table for the May meeting,” he said. That would double the 25-basis point increase at its March meeting, which now looks relatively puny compared to the yield on the 10-year Treasury, which is rapidly approaching a three-handle for the first time since 2018.

St. Louis Fed president James Bullard, suddenly the most hawkish voting member on the Fed’s monetary policy committee, said he thinks a 75-basis point hike is more appropriate. However, he conceded that “more than 50 basis points is not my base case at this point.” Still, 50 bps is a lot better than 25 bps in bringing the Fed’s target closer to the so-called neutral rate, which is when Fed policy is neither accommodative nor restrictive, and the Fed is nowhere near that (although no one really knows what the magic number is). With six more meetings to go this year, including May’s, 50 bps at each meeting would push the fed funds rate above 3%.

That seems awfully aggressive, given the Powell Fed’s generally dovish inclinations. Still, it may have no choice given that Continue reading "Let's Get Serious"

Here's How to Handle Inflation

I have to admit I almost fell out of my chair when I dug deep into the latest inflation numbers. Compared to a year ago, prices are up a jaw-dropping 8.5%. And in March alone they grew 1.2%. That’s the biggest single-month increase in the last 6 months. And if you look at the trend since the last year, those monthly increases are getting bigger, not smaller.

But that’s not all. If you take a stroll down the different components of the price increases, there’s pretty much nowhere to hide. Compared to a year ago, food is up 9%, used cars and trucks are up 35%, gas is up 48%, and fuel is oil up a mind-numbing 70%. Here are the grisly details in chart form:

Inflation

Source

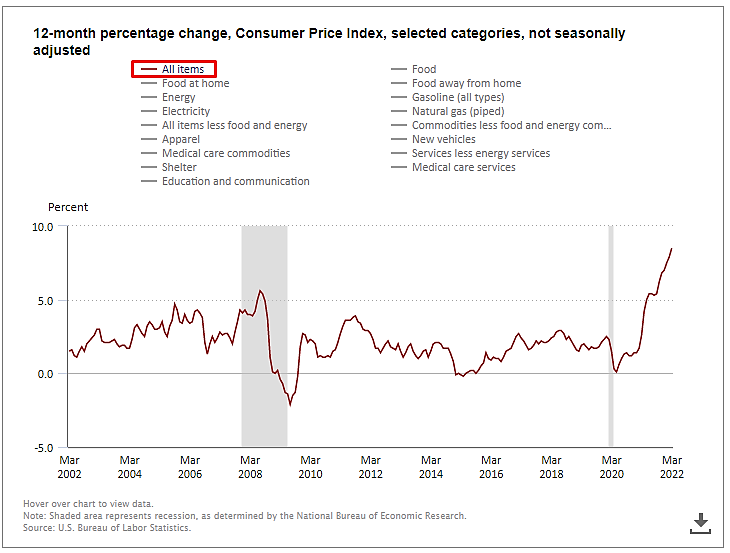
As you can see from this chart, top-line inflation is at multi-year highs. In fact, the 8.5% year-ago increase in March is the biggest 12-month increase since December 1981.

Now, take a look at the same chart, but the more volatile food and energy components stripped out: Continue reading "Here's How to Handle Inflation"

Gold Declines As Fed Prepares To Fight Inflation

The Federal Reserve’s next FOMC meeting is just under two weeks away, and market participants are gaining insight from Chairman Powell and other Federal Reserve voting members. Recent statements by Chairman Powell have indicated a major shift in his position regarding inflation. Up until his most recent statements, he maintained that inflation levels had peaked, were transitory, and would begin to decline. However, he has been forced to reevaluate those assumptions based on the reality that the CPI is currently at 8.5% for March, and the PCE index came in at 6.4% in February. PCE numbers for March will be released on April 29.

Statements by all members of the Federal Reserve have intrinsically contained subtle changes in words used to describe their forward guidance; this was not the case this week when Chairman Powell addressed the issue of inflation head-on.

For the first time, Powell was forced to acknowledge that “it is appropriate to be moving a little more quickly... Our goal is to use our tools to get demand and supply back in synch…and do so without a slowdown that amounts to a recession... It is going to be very challenging.”

During the March FOMC meeting, the Federal Reserve began its process of interest rate normalization or “lift-off” by raising the Fed Funds rate from virtually zero (0% to .25%) by .25% taking interest rates to 25 – 50 basis points.

The most recent inflationary data indicates that Americans are experiencing the highest inflationary pressure since January 1982, which makes it almost certain Continue reading "Gold Declines As Fed Prepares To Fight Inflation"

The Continuum: Through The Limiters!

Inflation pushes the 30-year Treasury bond yield through long-term moving average trends!

Okay, let’s take a breath. I don’t like to use ‘!’ in titles or even in articles. In fact, when I see too many of them I immediately think that someone really REALLY wants me to see their point. That said, the signal shown below is pretty important.

It’s in-month with a monstrously over-bearish bond sentiment backdrop similar to when we installed a red arrow on the chart below at the height of the Q1 2011 frenzy (cue the Bond King: “short the long bond!”). Chart jockeys are probably delivering the bad news of the chart’s inverted H&S, a potential for which NFTRH began managing a year ago when the 30yr yield hit our initial target of 2.5% and then recoiled as expected after the public became very concerned about inflation.

larry

But we were planning for the possibility that the pullback could make a right side shoulder to a bullish pattern, and so it did. Now the question is whether the Continuum continues (resumes its long journey down) or does something it has not done for decades, which is to break the limiting moving average trends. It’s an important question, states Captain Obvious. Continue reading "The Continuum: Through The Limiters!"