Chart of The Week - Soybeans

Each Week Longleaftrading.com will be providing us a chart of the week as analyzed by a member of their team. We hope that you enjoy and learn from this new feature.

This week's focus shifts to the grain markets and looming USDA reports that will be released during today's trading session. The general sense is that Soybean planted acreage could be higher than expectations. The Department of Agriculture is expected to report a significant shift in planted acreage to Soybeans from Corn because of favorable pricing. In the past week, this sentiment seemed to be continually priced into the market. Any indication of less than expected acreage could add fire to an already bullish market and cause May Soybeans to make a move toward $15.

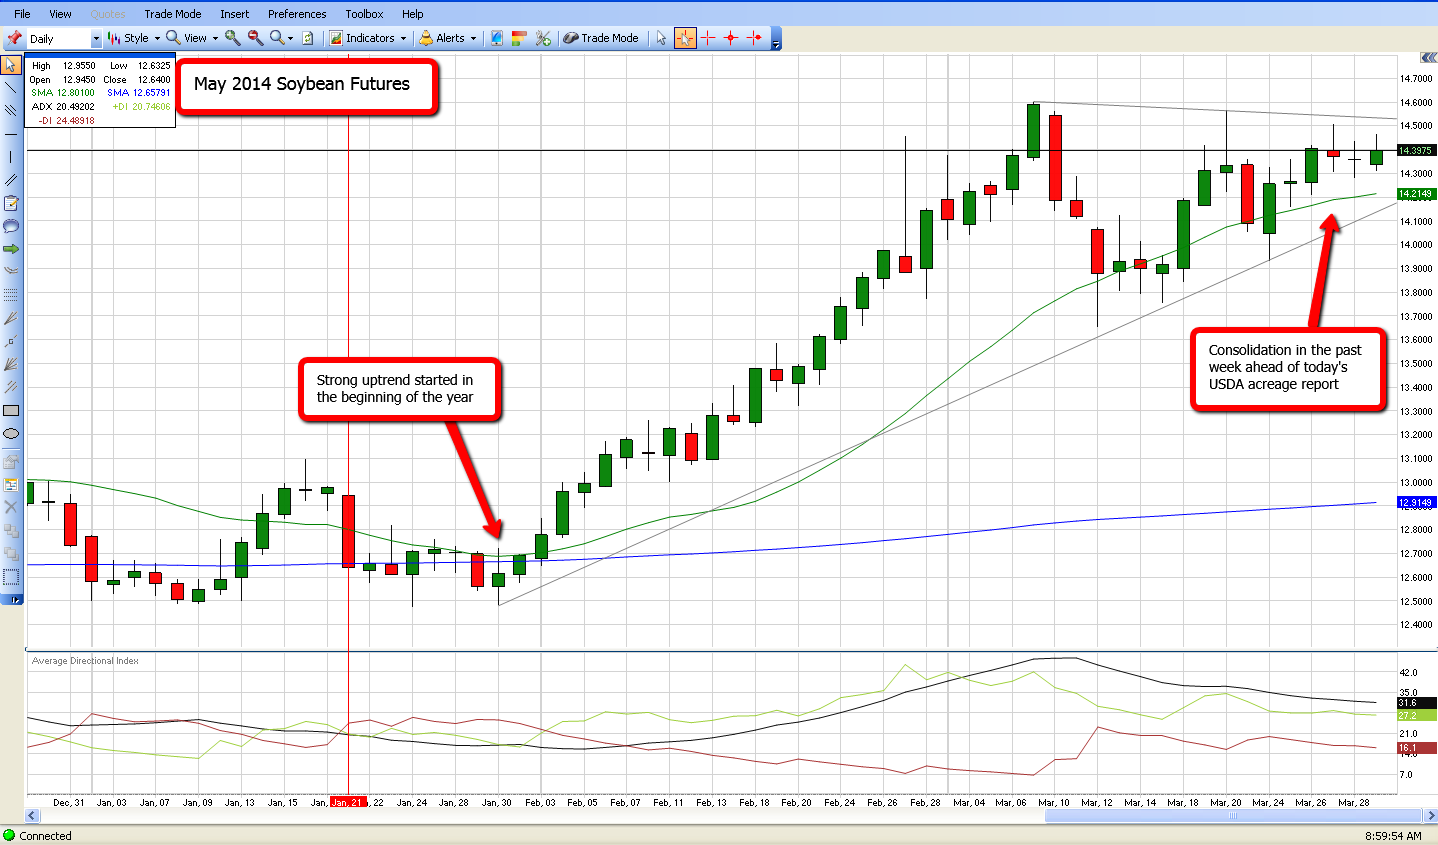
As we turn to the May Soybean chart, we are able to clearly identify a very strong up-trend in the market since the start of the new year. After posting the high print of $14.60 on March 7, the market has consolidated as traders positioned themselves for today’s March 31st USDA report. With so much sentiment geared towards a large expected acreage in Soybeans, an underwhelming number is very possible. In this case, I would look to take a buying position in the Soybean market and look for $15/bushel in the near future. Continue reading "Chart of The Week - Soybeans"

Chart of The Week - Euro Futures

Each Week Longleaftrading.com will be providing us a chart of the week as analyzed by a member of their team. We hope that you enjoy and learn from this new feature.

This week’s focus turns to the June 2014 Euro currency futures, where recent weak March PMI results leads to a downward path of least resistance. The recent sell off has been supported by ongoing talk that the US might be closer to raising interest rates than previously thought, giving lift to the US Dollar.

We have seen a sharp retracement from the recent swing high of 139.66 posted on March 13, 2014. Last Wednesday and Thursday, we saw two sharp sell offs on increased volume, which would confirm a bearish sentiment for this week. Following the two day sell off, Friday saw a consolidation within Thursday’s range, and we open this week looking for a bearish continuation.

Continue reading "Chart of The Week - Euro Futures"

Chart of The Week - Natural Gas

Each Week Longleaftrading.com will be providing us a chart of the week as analyzed by a member of their team. We hope that you enjoy and learn from this new feature.

This week’s focus turns to the May 2014 Natural Gas futures (NYMEX:NG.K14.E), where the transition into spring seasonality and warmer weather has weighed down demand outlook. Over the winter months, we had continually seen larger than expected draws from Natural Gas supplies due to extreme winter conditions, but as US weather forecasts continue toward warmer levels, it appears the threat to already tight near-term supplies is diminishing.

Since reaching a high print of 4.893 a few weeks ago on February 24, 2014, May Natural Gas has taken a slight leg lower and consolidated over the past few weeks as it decides where it will head next. The Commitments of Traders report as of March 4th has shown traders have gone from a net long to a net short position on Natural Gas, which hints that the recent strong up-trend may be losing steam. In the near-term, I would agree with this negative bias, and look for a correction in the Natural Gas market.

For a swing trade, I would be a seller as the market moves below Friday’s low of 4.530. My near-term target would be the swing low of 4.393. This position would allow you to use the 20 day moving average as a resistance point, as this indicator has kept the market in check during the recent consolidation period. Continue reading "Chart of The Week - Natural Gas"

Chart of The Week - Silver

Each Week Longleaftrading.com will be providing us a chart of the week as analyzed by a member of their team. We hope that you enjoy and learn from this new feature.

In the May 2014 Silver (or Mini Silver) futures, a recent up-trend has consolidated just above the $21.500 level over the past seven trading sessions. Equity markets have been weighed down by a round of profit-taking in the initial morning hours, giving way to strong upside potential in the precious metals markets.

Yesterday's trading session, February 25, 2014, provided an outside reversal on the daily chart. The market failed on a downside move, reversed, and closed above the high at $22.030. This price action is a bullish near-term indicator. Continue reading "Chart of The Week - Silver"

Currency Chart of The Week - Japanese Yen

Each Week Longleaftrading.com will be providing us a chart of the week as analyzed by a member of their team. We hope that you enjoy and learn from this new feature.

In the March 2014 Japanese Yen (CME:6J.H14.E), a recovery from the recent two day sell off has been underway this morning. Uncertainty on the state of the US economy has provided support for the Yen. In the event of the stock market undergoing a profit-taking correction after 11 straight sessions in the green, we would expect a short term boost in the Yen.

The March Japanese Yen has recently corrected after posting a recent swing high of 9.927 on February 4, 2014. Since correcting, the 20 Day Moving Average has acted as support on multiple occasions, and we anticipate it will continue to do so in the near term.

Using the 20 day moving average as a support level, I expect another leg up in the Japanese Yen if we break the high in yesterday’s session of 9.829 today. Along with a strong relative strength index reading, the near-term upside target for this move would be the swing high of 9.927. In this instance, it would be fitting to roll stop orders behind the position, as the 200 day moving average sits just below the swing high and may act as resistance. Continue reading "Currency Chart of The Week - Japanese Yen"