Sterling Momentum Softens

Lior Alkalay - INO.com Contributor - Forex


In our last review on the Pound Sterling, we noted that the currency had been weak amid a soft patch in the UK economy. The pace of GDP Growth was slowing and unemployment was no longer falling, yet the robust retail sales figure had provided a bright spot for Sterling bulls. While growth momentum has continued to slow, it has remained fair, and with massive easing coming from across the Channel, i.e. the ECB’s QE program, Sterling was able to gain ground vs its European peer. Yet, with the BoE meeting looming next week, and the release of the February inflation report and Mark Carney’s follow speech, there is growing speculation that the BoE may open the door for a possible retreat, or perhaps even a U-Turn, in its plans for rate hikes. What is that speculation based on and how could it impact the Pound Sterling? Continue reading "Sterling Momentum Softens"

The Ramifications of the SNB Move

Lior Alkalay - INO.com Contributor - Forex


By now you’ve heard the news; a Swiss tsunami has hit FX markets. In a historic move that took even the most seasoned investors and experienced brokers by complete surprise, the Swiss National Bank (SNB) has removed the 1.2 floor for the EUR/CHF, effectively eliminating the Swiss Franc’s peg to the Euro. The Swiss Franc, as a result, surged a jaw dropping 38% vs the Euro and 29.7% vs the Dollar in only a few hours, leaving Swiss equities tumbling and Swissie bears crushed. Undoubtedly, this aggressive move and the volatility it generated will be talked about for years. But what does this SNB move say about Switzerland, about the Euro and, more specifically, about the Swiss Franc’s future?
Continue reading "The Ramifications of the SNB Move"

Is The Ruble Meltdown Over?

Lior Alkalay - INO.com Contributor - Forex


The 16th of December will be remembered by investors across the globe, and Russia specifically, as “Black Tuesday;” a day when investors got a quick and unwelcome reminder of the 1998 crisis during which Russia was bankrupted. On Black Tuesday, the Ruble tumbled by 21.1% in less than a day and hit 78.51; Credit Default Swaps (CDS) for 5 years have priced in a 8.8% chance for a Russian bankruptcy. Black Tuesday was, simply put, an utter meltdown; investors were in a panic, Russians were running to the banks and the risk of a total collapse of the Russian economy hung in the air. Yet two weeks later, as some of the chaos from that Black Tuesday began to dissipate, some stability has emerged and with it the Ruble has regained some lost ground. The two questions which beg to be asked and answered; Is it the calm before the storm or perhaps a step toward stability? As we attempt to answer these questions we will also, hopefully, shed some light on the Ruble’s possible trajectory as a consequence.

What Ignited the Chaos?

Although it is still debatable as to what exactly was the last straw, there are clearly two very big contenders. The first was Rosneft, the Russian oil giant, was effectively bailed out by the Russian State through the tapping of the country’s emergency reserves. Continue reading "Is The Ruble Meltdown Over?"

Sterling Back in the Game?

Lior Alkalay - INO.com Contributor - Forex


This week was undoubtedly a busy week for FX traders, with the utter meltdown of the Russian Ruble followed by Putin’s speech, the across-the-board selloff in emerging markets and the surprise negative rate announced by the Swiss National Bank. What this week won’t be remembered for is a Pound Sterling turnaround, yet I intend to illustrate in this article that that might just be in the cards.

Across the Channel

The fact that the Pound Sterling has shed value against the almighty Dollar might not come as a surprise; after all, the Dollar has rallied across the board as the Fed turned hawkish and the economy accelerated. But what is a surprise is why the Pound Sterling, the currency of an economy which has grown at an annual pace of 3%, has been essentially flat versus its European peer, the Euro? In short, after a robust performance from the UK economy, investors are beginning to get the sense that rather than continue accelerating the UK is been dragged down by the woes across the Channel with Europe pulling UK growth potential down. Below, the two major charts that made investors ponder and Sterling stagger.

Core Inflation Tumbles

The first and foremost piece of data is inflation, but not just headline inflation which is also affected by external factors such as Oil prices (which, as we all know, happen to be collapsing) but core inflation that isolates external volatile factors including energy and food. As you can see in blue, UK Core Inflation just took a nose dive, hitting 1.2%, just 0.5% above the Eurozone’s 0.7% core inflation rate. With such a collapse in inflation expectations investors are beginning to question the UK recovery, wondering instead if growth is about to slow rather than accelerate, or perhaps that wage growth is not just around the corner as the pundits have said, and that maybe the Eurozone’s own stagnant growth is dragging the UK down along with it.

Thereafter, comes job market data; although unemployment has fallen to 6% it’s stubbornly fixed at this level and the claimant count rate, which measures the fall in unemployed (as seen in our second chart) has slowed down in pace. That had led investors to ponder that perhaps the job market is about to reverse some of its earlier job gains and that unemployment could nudge a bit higher.

Claimant Court Reverses

This has all led to one very basic question; are rate hikes in the UK really on the table next year? What with inflation in a nose dive, wages failing to rise and unemployment perhaps on the verge of a hike? Certainly, the possibility of a rate hike being pushed back into 2016 seems, especially after those readings, more probable. And that pretty much explains the flat performance of Sterling even against a battered Euro.

Retail Sales Changes the Game?

So what is the game changer? We have established the reason(s) why Sterling has been stagnant thus far but what makes investors think the game has changed? In two words: retail sales. The robust retail sales figure coming out of the UK on Thursday, a 6.4% (YOY) gain, surprised even the most optimistic investors. That unexpectedly positive figure has resulted in yet another possible scenario for Sterling watchers; say, the one in which the recent mild UK data was just a temporary bump or a minor glitch, and that the UK is actually gearing up towards another fall in unemployment, a rise in wages and maybe even a rate rise in 2015.

Matching Technicals and Fundamentals

As seen in the chart below the reaction in the market was not too late to arrive and the EUR/GBP quickly took a nose dive amid renewed Sterling bets. This could very well be the start of another push south for the pair, especially considering the formidable resistance the pair has generated and how this resistance pattern was reinforced today. But, and although this could be the signal for the start of another bearish push in the pair, more needs to happen. Next week’s final Q3 GDP reading may very well provide that fuel, that impetus, which can push the pair below the 0.777 level. However, most investors are eying December’s CPI data and 4th quarter GDP which is due out next month. Because if those two readings follow suit after the robust retail sales numbers, the 0.777 support could be broken, and as the chart illustrates below, the next support for the pair may be quite distant, creating a potentially long bearish cycle for the pair and taking the Sterling bullish bet back into the game. So, if you are in it for the long haul, be patient; Sterling just may surprise you for the better.

USD/GBP
USD/GBP

Look for my post next week.

Best,
Lior Alkalay
INO.com Contributor - Forex

Disclosure: This article is the opinion of the contributor themselves. The above is a matter of opinion provided for general information purposes only and is not intended as investment advice. This contributor is not receiving compensation (other than from INO.com) for their opinion.

The Carry Trade That’s Set To Unravel

Lior Alkalay - INO.com Contributor - Forex


Carry trade... if that’s the first time you’ve come across that term you should know that "carry trade" is one of the oldest tricks in the books when it comes to foreign exchange trading. It is based on a very basic gap, specifically, the interest rate gap. The way investors use it to create alpha is by borrowing one currency with a lower interest rate and buying with the borrowed cash a currency with a higher one. The investor's gain is created then by the gap between what the borrower pays on the low yielding currency and what he earns on the high yielding currency. Of course, if the currency you buy appreciates in the process that would be even better.

Investors have been making good (i.e. profitable) use of this technique for years using various currencies. For instance, back in the 1990s and 2000s, investors would borrow the Japanese Yen, then buy the U.S. Dollar or Euro. Or as in the 2009-2010 period, they’d borrow the U.S. Dollar and buy the Euro (of course, back then rates were much higher). Usually, this would create inflows for the higher yielding currencies and as such lead to the currency’s appreciation. But what happens when this rate gap is threatened? As Euro bulls discovered just recently, it can create a meltdown of the trade rather quickly and the trend can reverse course just as fast. So, why am I telling you this? Why the sudden dive into the mechanics of the carry trade? Because just as you are reading those very words, a big carry trade is set to unravel and as it does, the trend it created is set up to reverse as well.

The Aussie Kiwi Carry Trade

One of most prominent carry trades of the past two years has revolved around the currencies of two neighboring countries, Australia and New Zealand. Ever since China’s economy began slowing and the commodity space began its bearish cycle, the Australian economy has likewise been slowing and, of course, as a result interest rates were cut to prevent the Aussie economy from further deterioration. However, while Australia suffered a slowdown, New Zealand, its smaller neighbor, has been faring well and growing above trend, thanks in large part to a prosperous dairy industry. Naturally, this created an interest rate deferential which is illustrated below and, as you might have guessed, a big carry trade that led the AUD/NZD to an utter collapse of 20.9% until it reached a multi-year low of 1.049. Yet, now as the pair is trading close to its record low, there are tentative signs emerging which suggest a turnaround could be in the making. This could lead the trend to reverse and allow investors to potentially bank on a big rebound of the AUD/NZD. Image courtesy of TradingEconomics.com.

New Zealand Interest Rate - Dec 2014

The Trend Unravels

So, why is the trend on the verge of unraveling? In one word: inflation. If Australia had lower interest rates along with a rate of inflation lower than New Zealand’s own, the trend would have no reason to reverse. Australian interest rates would remain low (or else be at risk of dropping lower), while New Zealand would have rising inflationary pressures that would justify higher rates. But that is not the case at all. In fact, Australia’s annual inflation rate is more than double New Zealand’s. Aussie inflation was reported at 2.3% YoY while New Zealand’s inflation stands at a mere 1%, and that is in spite of the one-off effect of a reduction in Australia’s electricity tax that lowered inflation. In other words, while interest rates in Australia are much lower, the inflation rate is much higher, shaking the fundamentals of the trend. This means that while the Reserve Bank of Australia (RBA) has neither the space nor the rationale for easing, the Reserve Bank of New Zealand (RBNZ) has at least one reason to cut rates and none to raise them, leaving the fundamentals of the short AUD/NZD to crumble and open the space for a rebound. Image courtesy of TradingEconomics.com.
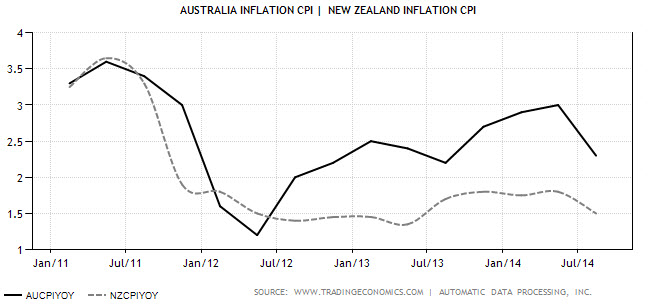
Australia Inflation CPI

Price and Projections

But now, there’s one final question, does the market show signs of a trend reversal in the AUD/NZD? The answer is yes. As seen below, each and every time the pair moved nearer to its record low of 1.049, buyers emerged. In fact, since the beginning of the year, buyers for AUD/NZD seem to reemerge, each time at a higher point, signaling a clear, albeit slow, sentiment shift. However, given that the RBNZ rate decision is set to take place next week and considering that the RBA took a decidedly neutral turn this week, the likelihood of an AUD/NZD trend reversal is on the rise, especially as the RBNZ governor continues, time and again, to point out that the Kiwi Dollar is "unjustifiably high." If that winds up being the case next week as well, that trend reversal could quickly accelerate. And as far as projections go? Looking at the chart, logically, we could be looking at a reversal toward at least 1.14 as this Aussie Kiwi carry trade unravels over the next couple of months.

AUD/NZD Monthly

Look for my post next week.

Best,

Lior Alkalay
INO.com Contributor - Forex

Disclosure: This article is the opinion of the contributor themselves. The above is a matter of opinion provided for general information purposes only and is not intended as investment advice. This contributor is not receiving compensation (other than from INO.com) for their opinion.