
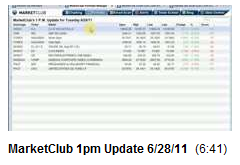
 Here is today's 1PM update for Tuesday, the 28th of June. Susan makes a confusing market very simple with MarketClub's "Trade Triangle" technology. Let us do the work for you. If you missed the live update, watch it now!
Best,
MarketClub
Here is today's 1PM update for Tuesday, the 28th of June. Susan makes a confusing market very simple with MarketClub's "Trade Triangle" technology. Let us do the work for you. If you missed the live update, watch it now!
Best,
MarketClub
 Hello, Adam Hewison here for MarketClub with your 1 p.m. market update for Wednesday the 18th of May.
Watch what's happening right now ...
S&P500: -60. Market very oversold. Long term uptrend remains intact. Market at the lower end of the Donchian Channel. Neutral - Trading range.
Silver: Score -60. possible bullish divergence on the Williams %R indicator. Major resistance at $39.50. Support at $32.00.
Gold: longer term trend still positive. Score +65. Support at $1,462.50. Resistance at $1,526.Trading Range
Crude Oil: +80 neutral Trading range. Long term indicator remains positive. Mid point on the Donchian Channel. Possible bullish divergence on the Williams %R indicator.
The Dollar Index: Score +55. In a trading range with the longer term outlook remaining negative. Possible negative divergence. Look for a pullback?? Major resistance remains at 77.50.Minor support at 74.00.
The Thomson Reuters/Jefferies CRB Commodity Index: Score -55. Near-term resistance at 348.50. Support at 333.50. Market very oversold on hedge fund liquidation. Bullish divergence on the Williams %R indicator.
All the best,
Adam Hewison
President of INO.com
Co-founder of MarketClub

Unfortunately, Adam is out of the office on business today. He did address some of the things to look for in today's market in yesterday's update. If you would like a refresher, click here to view MarketClub's Livestream Library.
Or, simply look for yesterday's update below in our blog.
No worries, it's business as usual again tomorrow! Tune in for your LIVE market update at 1PM ET with Adam Hewison and MarketClub's "Trade Triangle" technology.
Best,
The MarketClub Team
Here is a quick update:
Yesterday Google (symbol GOOG) flashed a sell and go short "Trade Triangle" signal at $525.61.
This is a significant event as the last signal we had for this stock was a buy signal at $372.36 on February 6th, 2009.
Fibonacci retracement indicates that this stock could pullback all the way to $419.62.
All the best,
Adam Hewison
President, INO.com
Co-creator, MarketClub
You are now leaving a Magnifi Communities’ website and are going to a website that is not operated by Magnifi Communities. This website is operated by Magnifi LLC, an SEC registered investment adviser affiliated with Magnifi Communities.
Magnifi Communities does not endorse this website, its sponsor, or any of the policies, activities, products, or services offered on the site. We are not responsible for the content or availability of linked site.