Historical Bear Market Comparisons

2022 Bear Market

Although there’s not an official bear market definition, those on Wall Street define a bear market as a 20% drop in the broader index. As of late May, the Nasdaq, Russell 2000, and S&P 500 have all breached that 20% sell-off threshold. This bear market is largely due to a confluence of the China Covid lockdowns, the Russia/Ukraine war, persistent inflation, and rising rates. All these bear market inputs are eroding companies’ margins and negatively impacting profitability and growth.

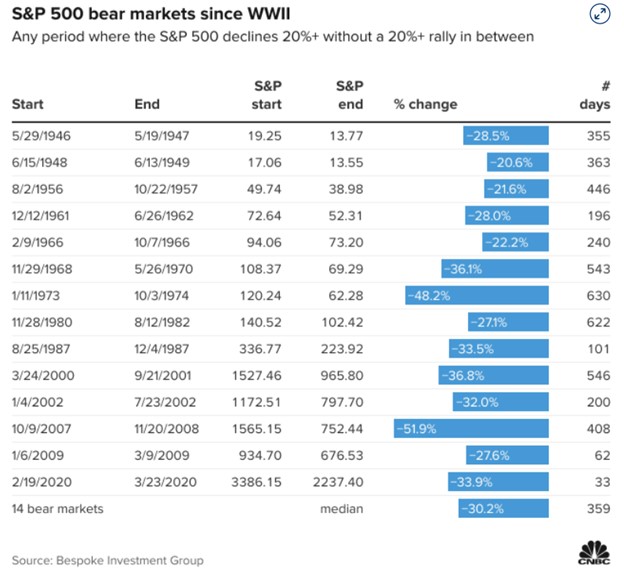
Looking at historical bear market comparators, there’s been 14 since World War II. The S&P 500 has pulled back a median of 30% and the selling has lasted a median of 359 days, per Bespoke Investment Group. It’s important to put the median in a statistical context, median translates into half the time the index has fallen more than 30% while half the time the index has remained above the 30% sell-off level. The 2022 bear market is only 136 days in as of March 20th, 2022. Although the median values suggest these markets may have a way to go, the resolution of one or a combination of the macroeconomic issues may be the needed catalyst for the bears to capitulate.

Bear Market Comparison

Markets On Edge

It's been challenging to endure the last five months of indiscriminate and relentless selling across all asset classes. The wealth destruction has been vast and safe haven stocks have been few and far between at this stage of the bear market. The bear has finally mauled Walmart (WMT), Apple (AAPL), and the flight to safety commodity, Gold (GLD) in its path of destruction. Continue reading "Historical Bear Market Comparisons"

Building A Portfolio In A Bear Market

No Place To Hide

A massive amount of portfolio wealth has been destroyed throughout this bear market that continues its carnage that started in January. Except for oil stocks, there hasn't been any place to hide, as the cryptocurrency market, gold, equities, and bonds have all scummed to the mauling of the bear. The current bear market has been brutal, with some individual stocks losing more than 90% of their value, such as Peloton (PTON), Beyond Meat (BYND), Coinbase (COIN), and Zoom Video (ZM). However, even high-quality large-cap companies with growing revenues and durable business models have not been spared and have sold off 30-50%, such as Disney (DIS), Microsoft (MSFT), Adobe (ADBE), Costco (COST), and Meta (FB).

During bear markets or an extended period of a market-wide correction, investors have the unique opportunity to purchase heavily discounted stocks at a fraction of the price compared to their peaks. As history indicates, establishing long-term positions during corrections can lead to outsized gains over the intermediate and long term. As the selling pressure abates and the macroeconomic backdrop resolves, building equity stakes in high-quality companies bodes well for investors. The most recent market-wide sell-off is due to a confluence of the China Covid lockdowns, the Russia/Ukraine war, persistent inflation, and rising rates. As these macro issues resolve over time, the markets will regain their footing and appreciate higher. The current market backdrop is the exact scenario where investors should be deploying cash on hand to snap up heavily discounted merchandise.

Cash Is King

Deploying cash into an environment where the selling is relentless and indiscriminate can be a daunting task. However, for any portfolio structure, having cash on hand is essential and in these environments is where this cash should be deployed in equities. This cash position provides investors with flexibility and agility when faced with market corrections. Cash enables investors to be opportunistic and capitalize on stocks that have sold off and have become de-risked. Initiating new positions and dollar cost averaging during these extended periods of weakness are great long-term drivers of portfolio appreciation. Absent any systemic risk; there are a lot of fantastic entry points for many high-quality large cap companies. Investors should not be remiss and capitalize on this buying opportunity because it may not last too long.

Anchoring And Dollar Cost Averaging

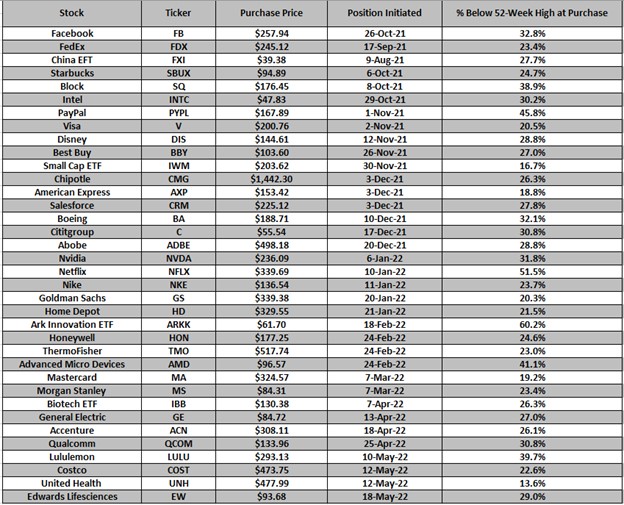
Purchasing stocks at the exact bottom is nearly impossible; however, purchasing stocks at attractive valuations in a disciplined manner over time is possible. For example, dollar cost averaging is a great strategy when anchoring down into a position with an initial sum of capital and following through with additional incremental purchases as the stock declines further. The net benefit is reducing the average purchase price per share in a sequential fashion (i.e., reducing cost basis). An example of building out a high-quality portfolio with subsequent dollar cost averaging throughput this market weakness can be seen in Figure 1.
Building A Portfolio In A Bear Market
Figure 1 – Initiating positions in high-quality companies with subsequent dollar cost averaging to lower the average purchase price over time. These long equity trades along with options-based trades can be found via the Trade Notification service

Conclusion

Purchasing stocks at the exact bottom is nearly impossible; however, purchasing stocks at attractive valuations in a disciplined manner over time is possible. During bear markets, investors have the unique opportunity to purchase heavily discounted stocks at a fraction of the price compared to their peaks. As history indicates, establishing long-term positions during corrections can lead to outsized gains over the intermediate and long term. As the selling pressure abates and the macroeconomic backdrop resolves, building equity stakes in high-quality companies bodes well for investors. The current market backdrop is the exact scenario where investors should be deploying cash on hand to snap up heavily discounted merchandise.

Having cash on hand is essential and in this environment is where this cash should be deployed in equities. This cash position provides investors with flexibility and agility when faced with market corrections. Cash enables investors to be opportunistic and capitalize on stocks that have sold off and have become de-risked. Initiating new positions and dollar cost averaging during these extended periods of weakness are great long-term drivers of portfolio appreciation.

Noah Kiedrowski
INO.com Contributor

Disclosure: Stock Options Dad LLC is a Registered Investment Adviser (RIA) firm specializing in options-based services and education. There are no business relationships with any companies mentioned in this article. This article reflects the opinions of the RIA. Any recommendation contained in this article is subject to change at any time. No recommendation is intended to constitute an entire portfolio. The author encourages all investors to conduct their own research and due diligence prior to investing or taking any actions in options trading. Please feel free to comment and provide feedback; the author values all responses. The author is the founder and Managing Member of Stock Options Dad LLC – A Registered Investment Adviser (RIA) firm www.stockoptionsdad.com defining risk, leveraging a minimal amount of capital and maximizing return on investment. For more engaging, short-duration options-based content, visit Stock Options Dad LLC’s YouTube channel. Please direct all inquires to

in**@st*************.com


. The author holds shares of AAPL, ACN, ADBE, AMD, AMZN, ARKK, AXP, BA, BBY, C, CMG, COST, CRM, DIA, DIS, EW, FB, FDX, FXI, GOOGL, GS, HD, HON, IBB, INTC, IWM, JPM, LULU, MA, MS, MSFT, NKE, NVDA, PYPL, QCOM, QQQ, SBUX, SPY, SQ, TMO, UNH and V.

Signs Of Peaking Inflation?

Inflation – The Stock Market Achilles Heel

The stock market is a forecasting instrument that anticipates and prices-in future economic conditions. The confluence of rising interest rates, inflation, China Covid lockdowns, and the war in Ukraine has resulted in months of selling. The relentless, indiscriminate selling has pushed the Dow Jones and S&P 500 deep into correction territory while pushing the Nasdaq deep into a bear market. As such, the market appears to be factoring in a worst-case scenario that may result in a Federal Reserve induced recession as a function of over-tightening of monetary policy and/or its inability to combat inflation responsibly for an economic “soft landing.”

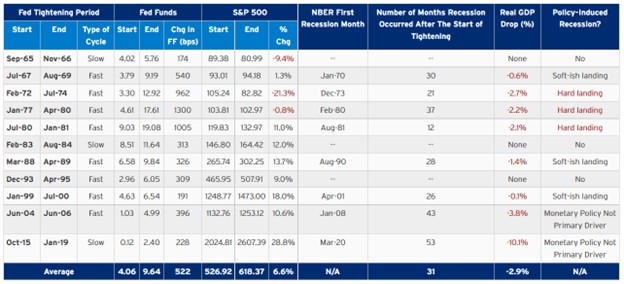
The markets are anticipating sequential rate hikes through 2023; however, if inflation has peaked and the tightening cycle turns dovish, then the markets will likely turn the tide on this relentless selling. If inflation has peaked and yields stabilize, these oversold conditions could easily reverse course. For April, market conditions have not been this bad for the Nasdaq and S&P 500 since the Financial Crisis and the Covid 2020 lows, respectively. With signs of inflation peaking, the markets may have fully priced in a worst-case scenario for an inflection point from these oversold conditions. During Federal Reserve tightening cycles, markets typically generate positive returns with an average of a 6.6% return over the tightening period (Figure 1).

Inflation
Figure 1 – Market performance during periods of Federal Reserve tightening cycles

Signs Of Peaking Inflation

There are many areas of the economy where inflation is receding or has peaked. Although energy prices remain elevated due to the Russia-Ukraine conflict, other commodities and inputs into the CPI composite that contribute to inflation are falling. There have been pullbacks in used car sales, easing supply chains (China’s Covid lockdowns are prolonging the supply chain recovery), copper, steel, grain, soy, freight, lumber, and aluminum prices. Continue reading "Signs Of Peaking Inflation?"

Overly Pessimistic Market Conditions?

April – Worst Month Since 2008 Financial Crisis

As April ended, the Nasdaq logged its worst month since the 2008 financial crisis, while the S&P 500 logged its worst month since March of 2020 during the depths of the Covid pandemic. No company has been immune to the onslaught of the macroeconomic environment as many household names have seen their market capitalizations cut by 30%-60%, such as Meta (FB), Amazon (AMZN), Netflix (NFLX), Adobe (ADBE), Nvidia (NVDA) and PayPal (PYPL) to name a few. The Nasdaq and the S&P 500 finished out April at fresh lows for 2022, taking out their previous low in March, selling off 13.3% and 8.8% during April alone. The Dow Jones fared better, only selling off 4.9% for April.

There’s an array of macroeconomic headwinds that have underpinned this downturn. The Federal Reserve withdrawing monetary stimulus, continued supply chain challenges, rising rates throughout the remainder of 2022, chronic inflation, Covid-induced lockdowns in China, and the geopolitical crisis in Ukraine. As such, The Nasdaq and S&P 500 are off 23.9% and 14.3% from their all-time highs. These elements have potentially culminated in an overly pessimistic market, and great entry points are available for patient investors.

Google and Amazon Proxies

Both Amazon and Google closed out their largest monthly losses since the 2008 financial crisis. After earnings, Amazon dropped nearly 14%, leading to its largest one-day drop since 2006. This was on the heels of reporting a loss and issuing weak revenue guidance for the second quarter. Continue reading "Overly Pessimistic Market Conditions?"

Navigating Volatility - Risk-Controlled Portfolio

Controlling portfolio beta, which measures overall systemic risk of a portfolio compared to the market, on the whole, is essential as these markets continue to display bouts of extreme volatility. Containing volatility while generating superior returns relative to the market is the goal with an options-based portfolio. Mitigating risk within a portfolio can be achieved via a blended options-based approach where cash is held in conjunction with stock positions and an options component. Options alone cannot be the sole driver of portfolio appreciation; however, options can play a critical component in the overall portfolio construction to control risk and volatility.

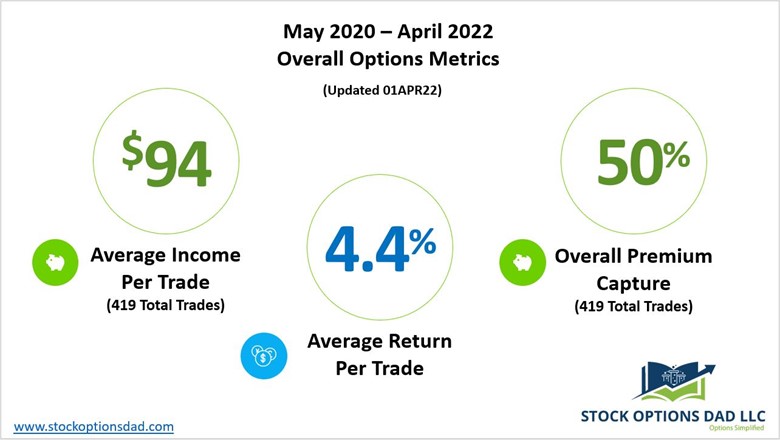
Generating consistent monthly income while defining risk, leveraging a minimal amount of capital, and maximizing returns is the core of the options-based portfolio strategy. Options can enable smooth and consistent portfolio appreciation without guessing which way the market will move. Options allow one to generate consistent monthly income in a high probability manner in various market scenarios. Over the past 24 months (April 2020 – March 2022), 419 trades were placed and closed. An options win rate of 97% was achieved with an average ROI per trade of 4.4% and an overall option premium capture of 50% while outperforming the Dow Jones throughout these two years. The performance of an options-based portfolio demonstrates the durability and resiliency of options trading to drive portfolio results with substantially less risk. The options-based approach attempts to circumvent market drawdowns and generated a return of 62.2% relative to the Dow Jones’ 58.2% (Figures 1, 2, and 3).

Controlling Volatility
Figure 1 – Overall option metrics from May 2020 to March 2022 available via a Trade notification service
Continue reading "Navigating Volatility - Risk-Controlled Portfolio"