Get ready for the Veg-O-Matic Markets

First Posted  almost 2 years ago and still relevant

September 29, 2009 by Adam

“This is Veg-O-Matic, the world-famous food appliance! . . . the only appliance in the world that slices whole, firm tomatoes in one stroke, with every seed in place. . . . French fries? Make hundreds in one minute! . . . Isn’t that amazing?!”

Let’s face it, the really big money is made in the big trending markets. What happens after a big trend comes to an end? Well, that is when you enter into a period of uncertainty.

Some traders like to characterize this as a trading range. I would refer to it as a Veg-O-Matic market, as it cuts and slices most traders to pieces.

No matter what you call it, trading range or Veg-O-Matic market, it is important to remember that you remain patient and wait for another defined trend to begin.

So how do you tell if a market is in a trading range?

The easiest way is to use MarketClub’s Trade Triangle technology. When you see a Chart Analysis Score of around 55-65 on the chart, it indicates that there is no discernible trend present. Trading range markets, or Veg-O-Matic markets, are best left to the professionals.

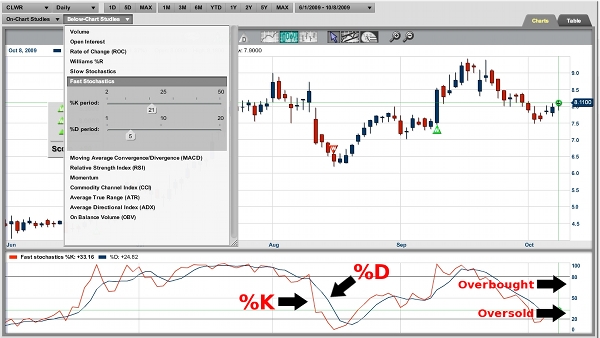
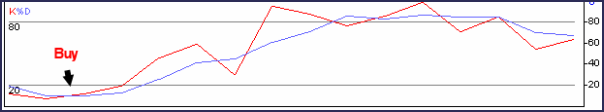
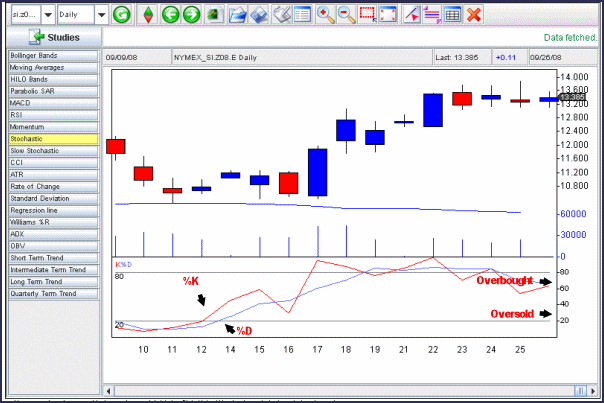
If you do feel the urge to trade in a market like I described above, you are better off using some sort of oscillator like the Williams %R indicator or a fast stochastic indicator. These indicators allow nimble traders to catch the swings, up and down. For the average trader, this is a time to be on the sidelines and looking at other opportunities in other markets.

Make no mistake about it, trading range markets are generally difficult to trade and generally do not give up profits easily.

So remember, if it’s a big Veg-O-Matic market, you’re better off waiting on the sidelines until you see a clear trend develop.

All the best,

Adam Hewison
President, INO.com
Co-creator of MarketClub.com

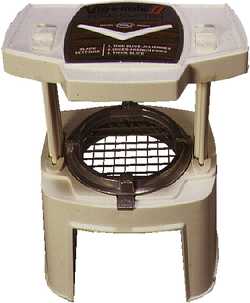
P.S. Samuel J. Popeil invented the Veg-O-Matic. He also created the frenzied ads that made his product a late-night television sensation in the late 1960s and 1970s.

Trader's Toolbox: Stochastics (K%D)

Yesterday you freshened up with the Williams %R oscillator. Today we have an indicator that you may or may not be familiar with as well.Like we have said before, if you have used other technical analysis indicators previously, you can use a combination of the studies and other techniques in conjunction with the "Trade Triangles" to further confirm trends.

The stochastics indicator created by George Lane measures the relative position of the closing price within a given time interval. This indicator is based upon the premise that prices tend to close near the upper portion of a trading range during uptrends and near the lower portion of a trading range during downtrends. When prices close in the middle of a range, this suggests a sideways market. There are two components to this calculation, the %K value and the %D value. The %K is calculated as follows: %K= (C-Ln / Hn – Ln) x 100 where C = closing price of current period, Ln = lowest low during n time periods. Hn = highest high during n time periods and n = number of periods.

The %D value is the moving average of the %K value. The simple moving average calculation is: %D = 100 (Hn / Ln) also in the %K formula.

These formulas produce two lines that oscillate between a scale of 0 and 100. As with the other oscillators, a stochastic value below 30% suggest an oversold condition, while a value greater than 70% suggests an overbought condition.

Some simple trading rules apply in the use of the stochastics indicator. A sell rule would be to sell when the fast (%K) crosses over the slow (%D) and both are pointing down, but are still above the 70% level. A buy signal would be triggered when the fast crosses the slow, and both point up, but are below the 30% level.

Another type of signal occurs when the stochastics indicator diverges from a price move similar to momentum and RSI.

---

You can learn more about the Stochastics and George Lane by visiting INO TV.

Trending And Trading Markets – Finding The Best Indicators For Each

Today's guest is Karen Stanlake of RangeTraders.com. Karen is going to tell us about the difference between trading and trending markets and some tools she uses in each market condition.
-------------------------------------------------------------------------------------------------------------------------------
Markets will either trend or trade. That is, they either move up, down, or go sideways. A common mistake is applying the wrong indicator to the wrong market condition. That would be like wearing a winter coat on a July afternoon in Phoenix!

There are some strategies that do use both types of indicators simultaneously, usually on multiple time frames. That’s beyond the scope of this article, but here are some ideas to help ensure your charts are properly attired for the market you’ve chosen to analyze. Continue reading "Trending And Trading Markets – Finding The Best Indicators For Each"

Traders Toolbox: Stochastics (K%D) Revisited...

Trader's Toolbox

At MarketClub our mission is to help you become a better trader. Our passion is creating superior trading tools to help you achieve your goals -- no matter which way the markets move -- with objective and unbiased recommendations not available from brokers.

The Trader's Toolbox posts are just another free resource from MarketClub.

---

"MarketClub is known for our “Trade Triangle” technology. However, if you have used other technical analysis indicators previously, you can use a combination of the studies and other techniques in conjunction with the “Trade Triangles” to further confirm trends.

The stochastics indicator created by George Lane measures the relative position of the closing price within a given time interval. This indicator is based upon the premise that prices tend to close near the upper portion of a trading range during uptrends and near the lower portion of a trading range during downtrends. When prices close in the middle of a range, this suggests a sideways market. There are two components to this calculation, the %K value and the %D value. The %K is calculated as follows: %K= (C-Ln / Hn – Ln) x 100 where C = closing price of current period, Ln = lowest low during n time periods. Hn = highest high during n time periods and n = number of periods.

The %D value is the moving average of the %K value. The simple moving average calculation is: %D = 100 (Hn / Ln) also in the %K formula..."

Revisit the Trader's Toolbox Post: "Stochastics" here.

Get ready for the Veg-O-Matic Markets

"This is Veg-O-Matic, the world-famous food appliance! . . . the only appliance in the world that slices whole, firm tomatoes in one stroke, with every seed in place. . . . French fries? Make hundreds in one minute! . . . Isn't that amazing?!"

Let's face it, the really big money is made in the big trending markets. What happens after a big trend comes to an end? Well, that is when you enter into a period of uncertainty.
Continue reading "Get ready for the Veg-O-Matic Markets"