Gold Update: That's It?

It’s really amazing to see how some people take a selfie every day from childhood and then compile a video from those photos to see the timeline of their life.

As gold reached all preset targets, hitting a new seven-year maximum of $1704, I think it’s an excellent time to contemplate the history of this large move up. I put the charts from the previous posts one by one to restore the timeline with my comments for you. Let’s start the time machine!

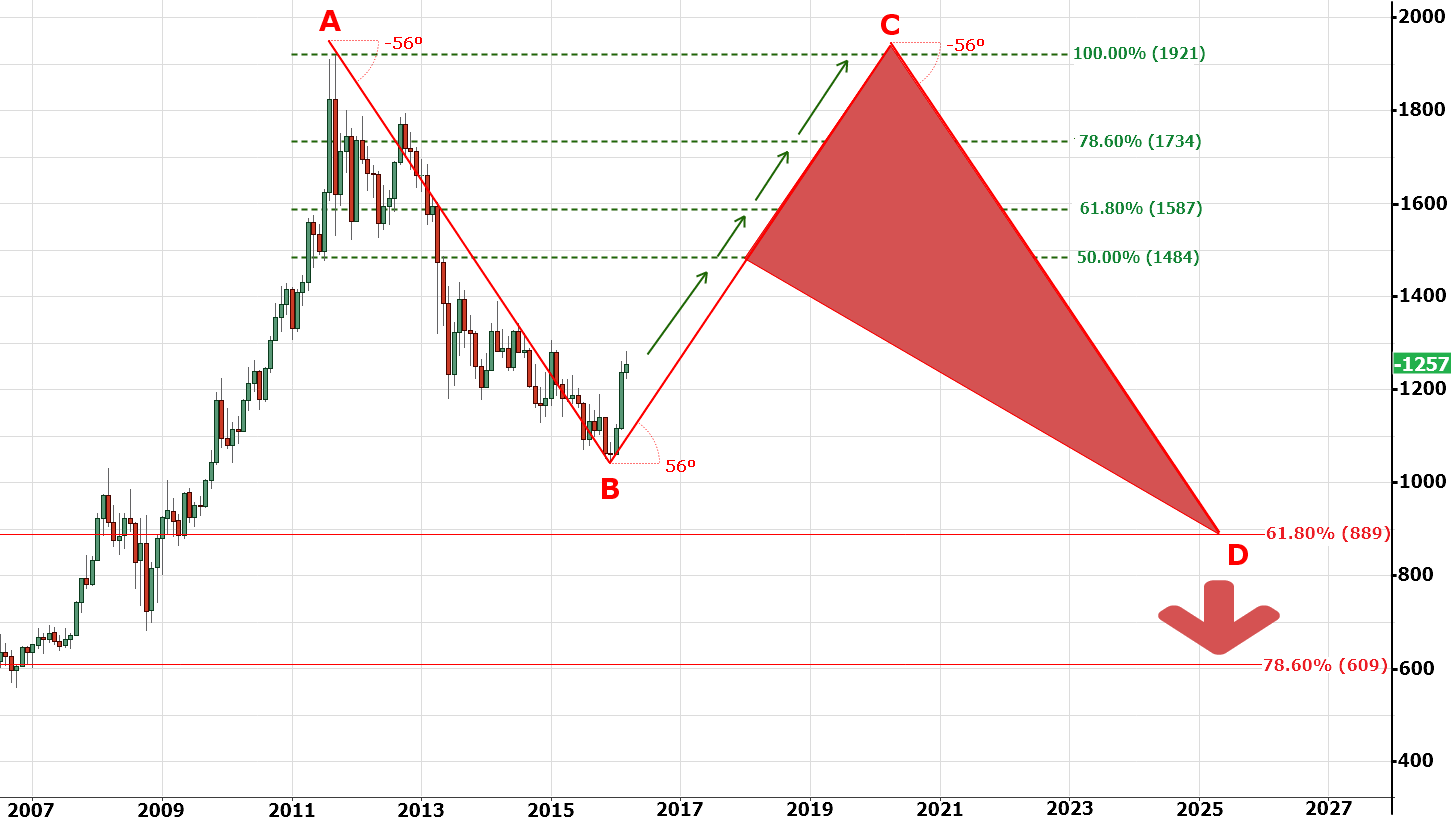
Chart 1. Global Monthly Chart Of 2016
Gold
Chart courtesy of tradingview.com

Four years ago, when the “Bulls Finally Took The Ball”, I posted a big map to share with you my view about a possible sizeable complex correction for gold to warn you of a time-consuming zigzag move. It was meant to become a real roller coaster with a big up and down move. It consists of two Fibonacci retracement areas. Green colored was set for the current move up. We almost reached 78.6% last week as price grew by $447 or 36% since that post in 2016. Continue reading "Gold Update: That's It?"

U.S. 10-Year Yield: It's Not "If" But "When"

Life is full of surprises as we never know what could happen next, and it is the true phenomenon of our existence. Last time I shared my thoughts about the U.S. 10-year yield (10Y) in September of 2018 calling for a rise to 3.33% and more. JPMorgan Chase CEO Jamie Dimon warned that time to be prepared for a 5% 10-year yield. Let’s take a look a what you thought then.

10-Year Yield

Most of you agreed with JPM’s CEO and hit the 5% option. The atmosphere then was so elevated that it was easy to believe that the rates would keep rising. Indeed, the market went higher but stopped at the 3.26% mark, and that was it. The least favored target of 3.33% appeared to be the closest call.

The precious metals’ posts schedule was busy here on the blog at the end of last year, so I posted my call at tradingview.com for 10-year yield to drop to tag the previous low of 1.34% on November 14th of 2019. Below is the chart of that post. Continue reading "U.S. 10-Year Yield: It's Not "If" But "When""

Silver Has Three Options To Go

Last week I showed you the chart where gold and silver were compared. The latter was in a worrisome lag behind the shining gold. I think most of us got tired to see if the white metal could update at least the top, that was hit last September amid gold striking one target after another reaching a 7-year maximum. Then I asked you to share your opinion as this alarming signal could be a double-edged sword. Below are your bets about it.

Silver

The majority picked the optimistic option of gold, leading the silver to the upside. The opposite came true last week as silver plummeted deep with a minus 14% off the week’s top dragging gold down; the latter lost almost an 8% off the weekly maximum. But before that, gold managed to reach target #4 at the start of last week!

What’s next for silver? Continue reading "Silver Has Three Options To Go"

Has The Equities Waterfall Event Started?

Or is this a buying opportunity? Over the past 5+ days, a very clear change in market direction has taken place in the US and global markets. Prior to this, the US markets were reacting to Q4 earnings data and minimizing the potential global pandemic of the Coronavirus. The continued “rally to the peak” process was taking place and was very impressive from a purely euphoric trader standpoint. Our researchers found it amazing that the markets and the Dow Jones Industrial Index continued to rally many weeks after the news of economic contraction and quarantines setup in China/Asia.

Make sure to opt-in to our free-market trend signals newsletter before you continue reading this or you may miss our next special report!

We believe a number of critical factors may have pushed global investors away from their comfortable, happy, bullish attitude over the past 5+ days – most importantly the reality that the virus pandemic was very real and would continue to result in a more severe global economic contraction process and the outcome of the Caucus voting where Bernie Sanders appears to be leading almost every early voting event. There are now two major concerns hanging over the global markets and the future of the US 2020 Presidential elections. These two major issues may be enough to change investor sentiment and present a very real volatility event.

Uncertainty breeds fear and can cause traders to move away from risk. We discussed these topics in research posts many months ago. Continue reading "Has The Equities Waterfall Event Started?"

Gold Hits Target And Seven Year High

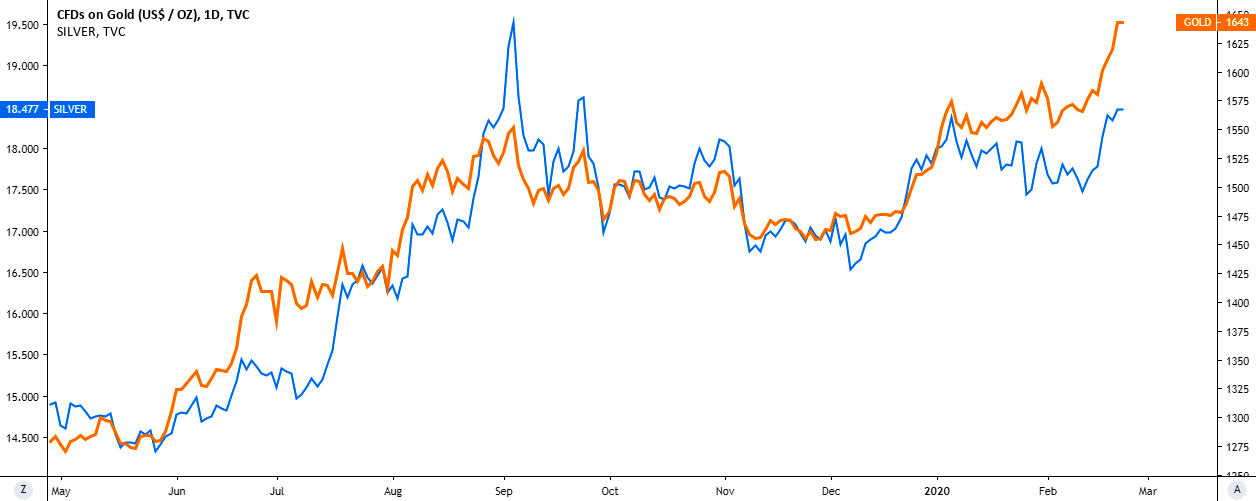
Before we start analyzing gold, let’s see how two precious metals behave in comparison on the chart below.

Gold
Chart courtesy of tradingview.com Gold (orange, right scale), Silver (blue, left scale)

This chart above starts from the bottom area of 2019. The most of the time, the yellow metal leads the game as Silver follows suit showing sharp moves to catch up with the gold. Sometimes the laggard throws over the leading trend amid excessive market reaction to the big moves of the top metal. Such extremes are rare and quickly get normalized by market “whales.” From this perspective, there is nothing new we can find on the chart. Continue reading "Gold Hits Target And Seven Year High"