U.S. Crude Oil Production Peaked In November

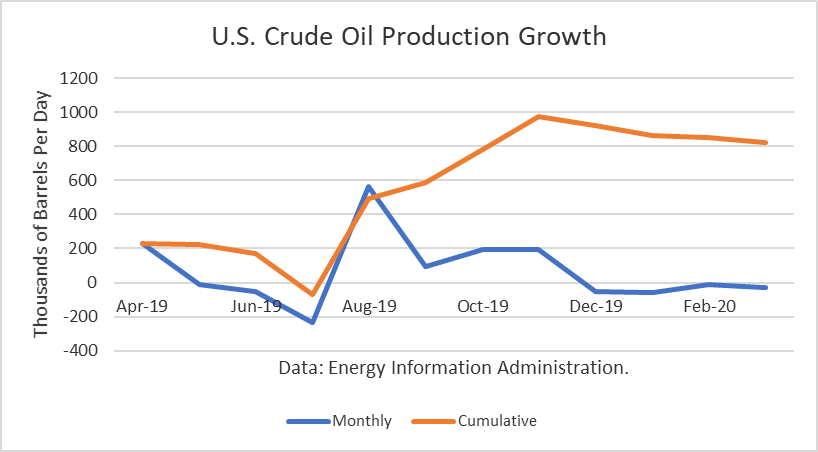
The Energy Information Administration reported that March crude oil production averaged 12.716 million barrels per day (mmbd), down 28,000 b/d from February. Reductions occurred in the Gulf of Mexico (41,000 b/d) North Dakota (19,000 b/d), and Colorado (13,000 b/d). Because of the oil price war and demand destruction, the collapse in oil prices likely undercut output in March, but the substantial drop in production started in April.

Texas production rose by 67,000 b/d to an all-time high of 5.422 mmbd.

Crude Oil

The gains from last April were still 824,000 b/d. And this number only includes crude oil. Other supplies (liquids) that are part of the petroleum supply fell 490,000 b/d from a year ago. Continue reading "U.S. Crude Oil Production Peaked In November"

U.S. Crude Inventories Continue To Climb

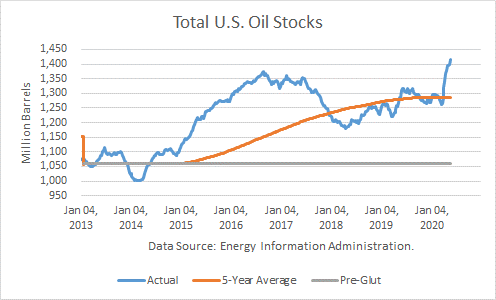
According to the Energy Information Administration, U.S. crude inventories (excluding SPR) built by 14.9 million barrels last week to 1.415 billion, whereas SPR stock built by 2.1 million. They stand 129 mmb above the rising, rolling 5-year average and about 129 mmb higher than a year ago. Comparing total inventories to the pre-glut average (end-2014), stocks are 356 mmb above that average.

Oil Stocks

Crude Production

Production averaged 11.400 mmbd last week, down 100,000 b/d from the prior week, and 11.600 mmbd over the past 4 weeks, off 4.9 % v. a year ago. In the year-to-date, crude production averaged 12.580 mmbd, up 4.2 % v. last year, about 500,000 barrels per day higher than a year ago. Continue reading "U.S. Crude Inventories Continue To Climb"

World Oil Supply And Price Outlook, May 2020

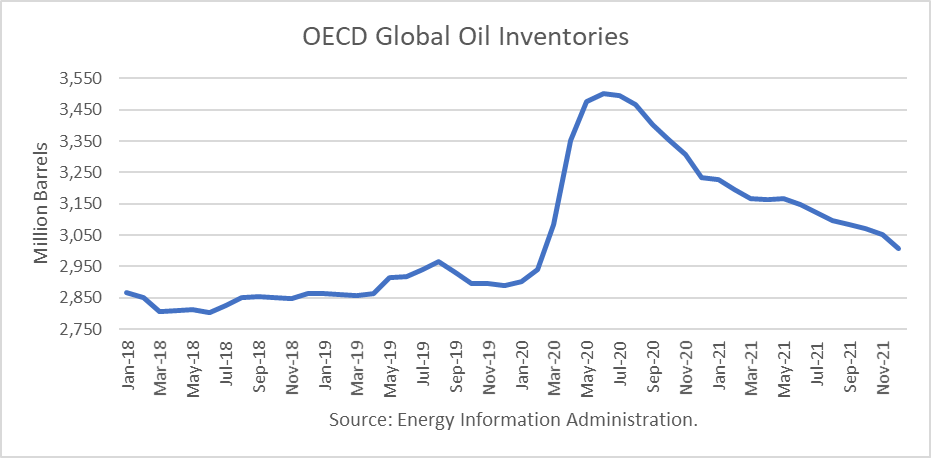
The Energy Information Administration released its Short-Term Energy Outlook for May, and it shows that OECD oil inventories likely bottomed last June 2018 at 2.802 billion barrels. It estimated stocks built by 267 million barrels in April to end at 3.352 billion, 488 million barrels higher than a year ago.

The EIA estimated global oil production at 99.15 million barrels per day (mmbd) for April, compared to global oil consumption of 76.34 mmbd. That implies an oversupply of 22.81 mmbd or 684 million barrels for the month. A figure never experienced in history.

For 2020, OECD inventories are projected to build by 347 million barrels to 3.351 billion. For 2021 it forecasts that stocks will draw by 227 million barrels to end the year at 3.007 billion.

Oil

The EIA forecast was made to incorporate the OPEC+ decision to cut production and exports. According to OPEC’s press release: Continue reading "World Oil Supply And Price Outlook, May 2020"

U.S. Crude Oil Production Peaked In February

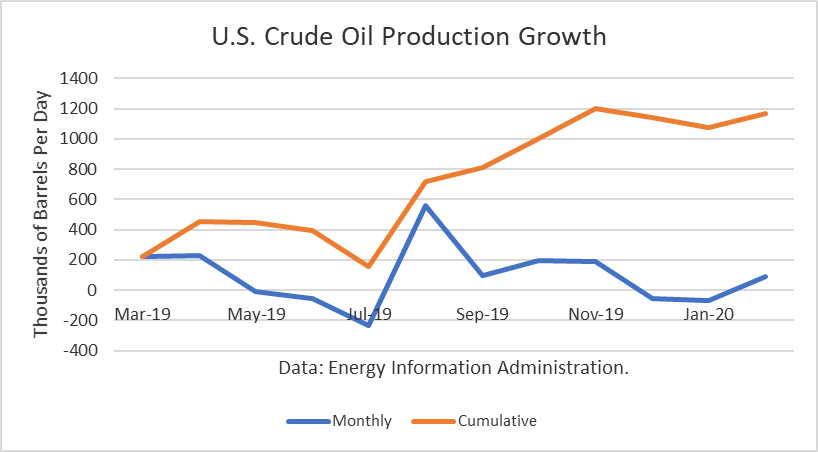
The Energy Information Administration reported that February crude oil production averaged 12.833 million barrels per day (mmbd), up,000 b/d from November. Reductions occurred in the Gulf of Mexico (87,000 b/d). Because of the oil price war and demand destruction, the collapse in oil prices likely undercut output in March, making February the peak in U.S. production.

Output rise in the Gulf of Mexico (41,000 b/d), New Mexico (37,000 b/d), North Dakota (27,000 b/d), and Oklahoma (27,000 b/d). Texas production fell by 5,000 b/d from its January all-time high.

Crude Oil

The gains from last March have amounted 1.164 mmb/d. And this number only includes crude oil. Other supplies (liquids) that are part of the petroleum supply fell 390,000 b/d from a year ago. Continue reading "U.S. Crude Oil Production Peaked In February"

Oil To Test Storage Capacity

Timing when oil storage will be full is one of the key issues of interest in the oil market. It depends on how long stays depressed, or how quickly it can rebound, and how much oil producers are cutting output in the U.S. and worldwide. The answers are unknown, but I will try to outline what is known and likely.

Oil data in the U.S. is the most timely and accurate, so that’s a good place to start. Crude oil inventories in Cushing, Ok., the delivery hub for the NYMEX WTI crude futures contract, reached 59.7 million barrels in the week ending April 17. About 2.1 million is used for line fill, and so 57.7 million is the net stocks held in tank farms. That represents 76 % of net working storage of 76.1 million barrels.

Given the excess storage, it would not explain why trader panic drove oil prices negative just prior to the expiration of the May contract. The reason was that the remaining storage was leased. “The terminals have already contracted their storage 100%,” said Ernie Barsamian, chief executive officer of The Tank Tiger, a terminal storage clearinghouse, was quoted.

And so traders who were still long but could not take delivery had to sell at any price. And buyers got Continue reading "Oil To Test Storage Capacity"