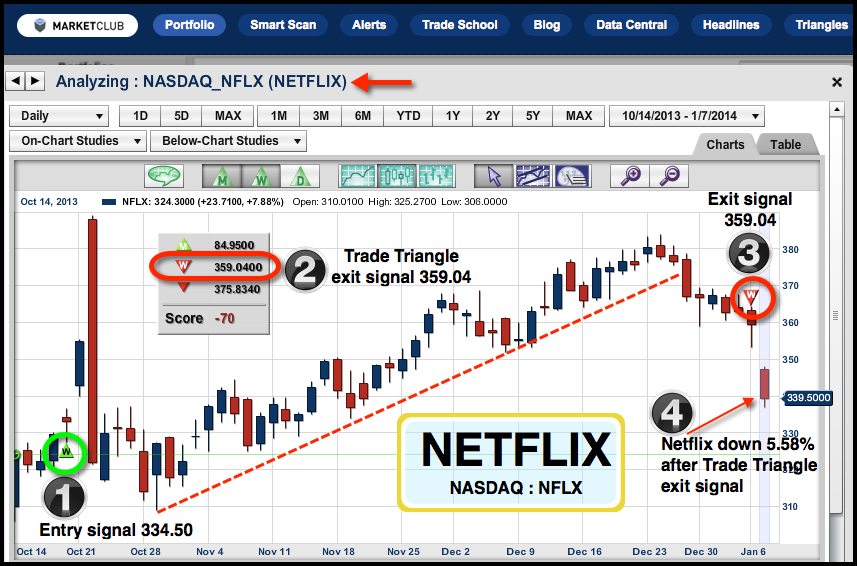
We've asked our friend Jim Robinson of profittrading.com to provide his expert analysis of charts to our readers. Each week he'll be analyzing a different chart using the Trade Triangles and his experience.
Today he is going to take a look at the technical picture of the Starbucks Corp. (NASDAQ:SBUX).
I hope you are having a GREAT week !
With stocks you use the monthly MarketClub Trade Triangles to tell trend and the weekly MarketClub Trade Triangles to time the entry and exit points.
With the monthly Trade Triangle pointing up and the weekly pointing down Starbucks Corp. (NASDAQ:SBUX) has set up a buying opportunity.
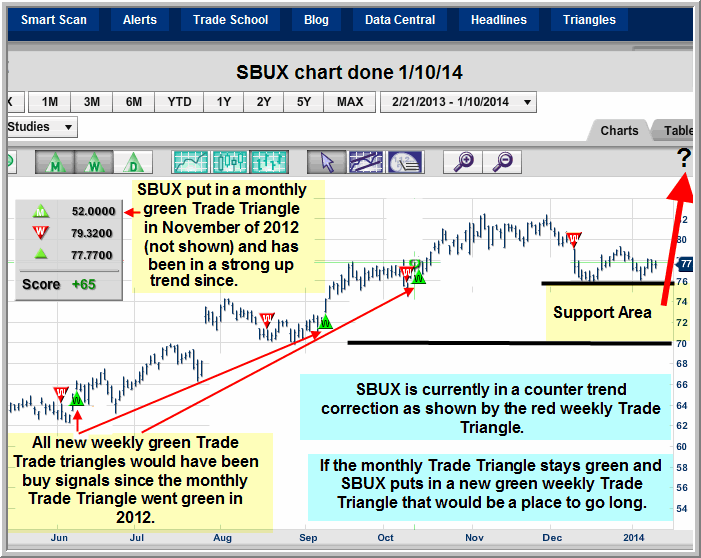
When the weekly Trade Triangle turns red (down) you wait for a new green weekly Trade Triangle (up) and then as long as the monthly Trade Triangle is still green you would go long Starbucks Corp.(NASDAQ:SBUX). Continue reading "Chart to Watch - Starbucks Corp. (Nasdaq:SBUX)"