Apple's Secret Weapon

Hello MarketClub members everywhere!

Once again Janet Yellen, the chairwoman of the Federal Reserve, gave the market yet another easy money "fix". Easy money is the drug of choice for this market and has been for the past six years. Can the insanity of printing more and more money keep going on and on, or will the market have to go into rehab and kick its easy money dependency? Only time will tell. Eventually someone, and that means all of us, will have to pay the piper.

MarketClub's Mid-day Market Report

As of today, many stocks, including the major indices, remain locked in broad trading ranges. This could all change as we come to the end the first quarter and move into April. Continue reading "Apple's Secret Weapon"

Bet On This Retailer For The Holidays

Daniel Cross - INO.com Contributor - Equities


The holidays are right around the corner, and that means retailers are gearing up for their biggest sales and marketing campaigns of the year. While the broader averages haven't given investors much to cheer about this year, one stock could still deliver gains and brighten up any portfolio.

Unemployment is down to just 5.1% with a healthy job market, and consumer spending is up over 3% and could be headed higher for the fourth quarter. Inflation, which began this year as a negative figure, has finally begun to pick up a little in the past few months as well and currently stands at 0.2%. Retail sales this year have been choppy with growth of 0.6% in July but only 0.2% and 0.1% in August and September. However, retail sales are still up 2.4% year-on-year.

A strong US dollar has been hurting stocks, but could be a positive factor for retailers going into the holiday season. A high dollar relative to other currencies make imported goods cheaper and could help out consumers. Continue reading "Bet On This Retailer For The Holidays"

Best Buy (NYSE:BBY) Implodes

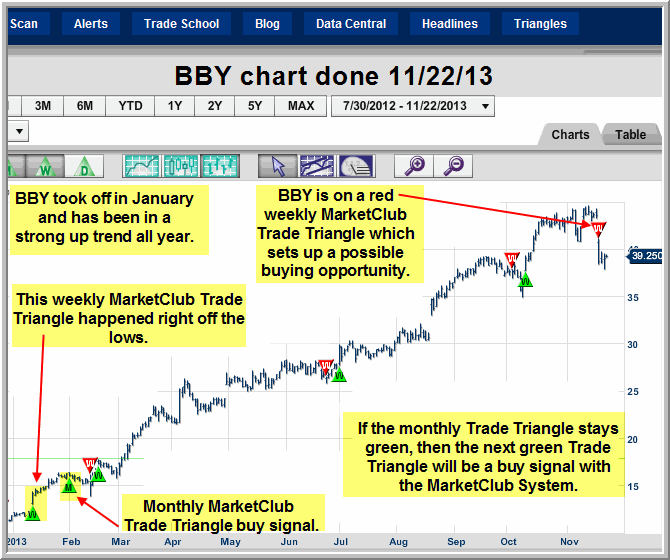
Best Buy Co., Inc. (NYSE:BBY) was one of the top performing stocks in 2013. Best Buy (NYSE:BBY) reported on Thursday that total revenue and sales at its established US stores fell in the all-important holiday season due to intense discounting by rivals, supply problems for key products and generally weaker traffic in December. After starting out the trading year of 2013 at $12, this stock performed like the energizer bunny and kept going and going and going for most of the year. It hit a high of $44.60 on November 13th, a month before the all-important holiday season reality set in.

What Does This Company Do?

Best Buy Co., Inc.(NYSE:BBY) operates as an e-commerce and physical retailer of consumer electronics in the United States, Europe, Canada, and China.

Was Best Buy's Implosion Predictable?

No one can predict with 100% certainty what's going to happen in any given market. What technical analysis can do, and does do very well, is put the odds in your favor and give you a high degree of confidence that something is going to happen. It also acts to protect your capital when things go wrong in a market. That is done through the use of money management and discipline, both of which I talk about frequently on this blog. Let me illustrate for you how two simple technical tools would have helped you avoid today's disaster in Best Buy. Continue reading "Best Buy (NYSE:BBY) Implodes"

This Pioneering Chart Pattern Is Still One Of The Best

By: Amber Hestla, Michael J. Carr

The head-and-shoulders (HS) top is one of the best-known patterns in technical analysis. This pattern was first written about in 1930 by a financial editor at Forbes magazine who described how the HS forms and how it can be traded.

Many readers are familiar with the HS pattern. On a price chart, there will be three peaks in price at the end of the uptrend, with the center peak (the head) being higher than the other two. The peaks on the sides (the shoulders) should be about equal in height. Continue reading "This Pioneering Chart Pattern Is Still One Of The Best"

Chart to Watch - Best Buy (BBY)

We've asked our friend Jim Robinson of profittrading.com to provide his expert analysis of charts to our readers. Each week he'll be analyzing a different chart using the Trade Triangles and his experience.

Today he is going to take a look at the technical picture of the Best Buy Co.,Inc. (NYSE:BBY).

I hope you are having a GREAT week! Best Buy Co., Inc. (NYSE:BBY) took off in January of this year and has for the most part not looked back making it one of this years biggest winners so far.

It is due for a larger counter trend correction which could have started with the current red weekly Trade Triangle. Continue reading "Chart to Watch - Best Buy (BBY)"