Advanced Trading Applications of Candlestick Charting

Candlesticks; used by many...truly understood by few. As a special treat to Trader's Blog readers, Gary Wagner is offering you an in-depth look into candlestick charting. Join co-founder of Wagner Financial Group. and acclaimed author as he walks you through set ups in ways you can take your candlestick charting to a new level.

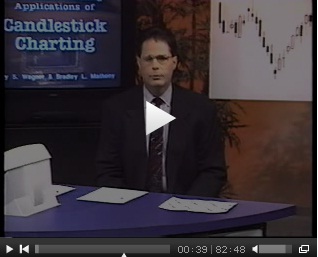
In this video workshop you'll discover the crucial chart patterns that candlesticks reveal - how to interpret them and how to use them to pinpoint market turns. You'll also learn how to use candlesticks in combination with familiar technical indicators like Stochastics, %R, Relative Strength Index and Moving Averages to create a dynamic, synergistic and extremely successful trading system.

WATCH NOW: Advanced Trading Applications of Candlestick Charting

Best,
The MarketClub Team

Trader's Toolbox: Williams %R

MarketClub is known for our "Trade Triangle" technology. However, if you have used other technical analysis indicators previously, you can use a combination of the studies and other techniques in conjunction with the "Trade Triangles" to further confirm trends.

Williams' %R oscillator, attributed to Larry Williams, is a variation of the stochastics indicator previously discussed. Because the two oscillators are essentially the same, only minor modifications to the formula are required. The formula for calculating %R is: %R = Hn – C / Hn – Ln where Hn = highest high of the period, C = Close of the current period and Ln = lowest low of the period.

The %R oscillator differs from the %K formula in the stochastics indicator because the outcome of each formula is inverse to the other. In other words, %K compares the close with the lowest low, whereas %R compares the close with the highest high. Similar to other oscillators, %R is plotted with horizontal zones of 20% and 80%. When the indicator has a reading of -80% or below it signifies an oversold condition. Similarly, a reading of -20% or above signals an overbought condition.

---

You can learn more about the Williams %R and Larry Williams by visiting INO TV.

POLL: Job Report

If you follow headline news, then we don’t have to tell you about the kind of hit that the recent job report had on the major markets this week. OUCH. Just today the DJI fell 105 points, the S&P 500 lost 10 points, and the Nasdaq fell 21 points. The DOW alone shed over 400 points since Wednesday!

The increase in unemployment has caused major concern for experts, as well as all of us regular ol’ citizens of the USA. The recent job report was a definite letdown, especially for economists who were predicting a rate of improvement from 9% to 8.9%. Yet here we are with an unemployment rate of 9.1%.

Where do you think the US unemployment rate will be at the end of 2011?

View Results

Loading ... Loading ...

Be sure to Joins Susan, live at 1PM (ET) for your live update on the markets!

Traders Toolbox: Reversals Revisited

Trader's Toolbox

At MarketClub our mission is to help you become a better trader. Our passion is creating superior trading tools to help you achieve your goals -- no matter which way the markets move -- with objective and unbiased recommendations not available from brokers.

The Trader's Toolbox posts are just another free resource from MarketClub.

---

Image Reactions Within A Downtrend

"Reversals In my opinion, one of the most misused and abused terms in technical analysis is the reversal or key reversal. I often get calls from both new and experienced traders who are excited about a market because it has just posted a “key reversal.” While the action these traders point to often marks a reversal day, such a day (week or month) by itself actually has little significance. There is research which indicates single period reversals mark a turn only about 50% of the time. Which gives about the same odds of indicating a turn using a coin flip..."

Revisit the Trader's Toolbox Post: "Reversals" here.