Analysis Of The EIA Statistics

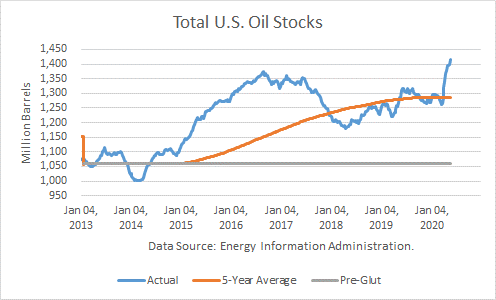
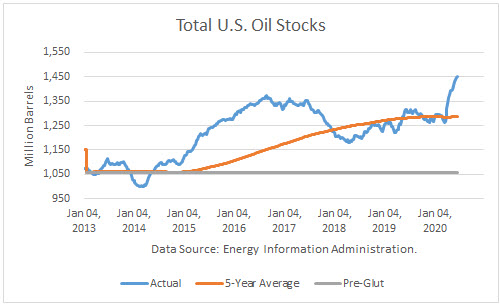
According to the Energy Information Administration (EIA), U.S. petroleum inventories (excluding SPR) built by 5.9 million barrels last week to 1.451 billion, whereas SPR stocks built by 1.4 million. Total stocks stand 163 mmb above the rising, rolling 5-year average and about 151 mmb higher than a year ago. Comparing total inventories to the pre-glut average (end-2014), stocks are 392 mmb above that average.

EIA

Crude Production

Production averaged 11.0 mmbd last week, up 500,000 b/d from the prior week, and 10.950 mmbd over the past 4 weeks, off 10.6 % v. a year ago. In the year-to-date, crude production averaged 12.311 mmbd, up 1.7 % v. last year, about 200,000 barrels per day higher than a year ago. Continue reading "Analysis Of The EIA Statistics"

U.S. Crude Oil Production Peaked In November

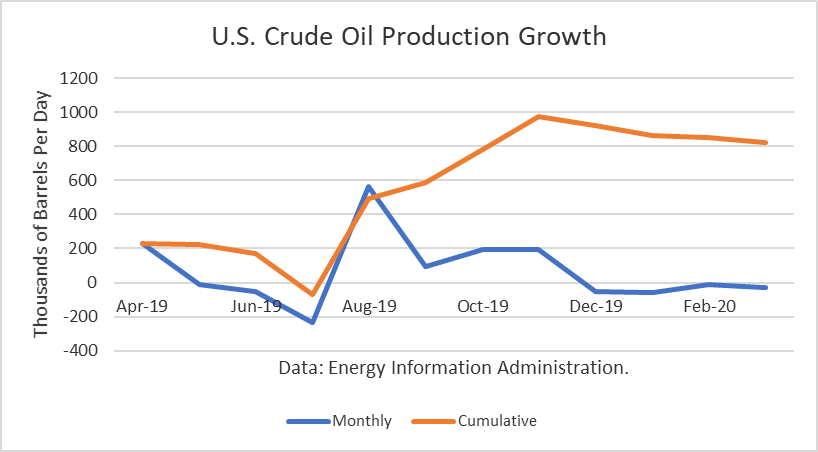
The Energy Information Administration reported that March crude oil production averaged 12.716 million barrels per day (mmbd), down 28,000 b/d from February. Reductions occurred in the Gulf of Mexico (41,000 b/d) North Dakota (19,000 b/d), and Colorado (13,000 b/d). Because of the oil price war and demand destruction, the collapse in oil prices likely undercut output in March, but the substantial drop in production started in April.

Texas production rose by 67,000 b/d to an all-time high of 5.422 mmbd.

Crude Oil

The gains from last April were still 824,000 b/d. And this number only includes crude oil. Other supplies (liquids) that are part of the petroleum supply fell 490,000 b/d from a year ago. Continue reading "U.S. Crude Oil Production Peaked In November"

U.S. Crude Inventories Continue To Climb

According to the Energy Information Administration, U.S. crude inventories (excluding SPR) built by 14.9 million barrels last week to 1.415 billion, whereas SPR stock built by 2.1 million. They stand 129 mmb above the rising, rolling 5-year average and about 129 mmb higher than a year ago. Comparing total inventories to the pre-glut average (end-2014), stocks are 356 mmb above that average.

Oil Stocks

Crude Production

Production averaged 11.400 mmbd last week, down 100,000 b/d from the prior week, and 11.600 mmbd over the past 4 weeks, off 4.9 % v. a year ago. In the year-to-date, crude production averaged 12.580 mmbd, up 4.2 % v. last year, about 500,000 barrels per day higher than a year ago. Continue reading "U.S. Crude Inventories Continue To Climb"

U.S. Crude Oil Production Peaked In February

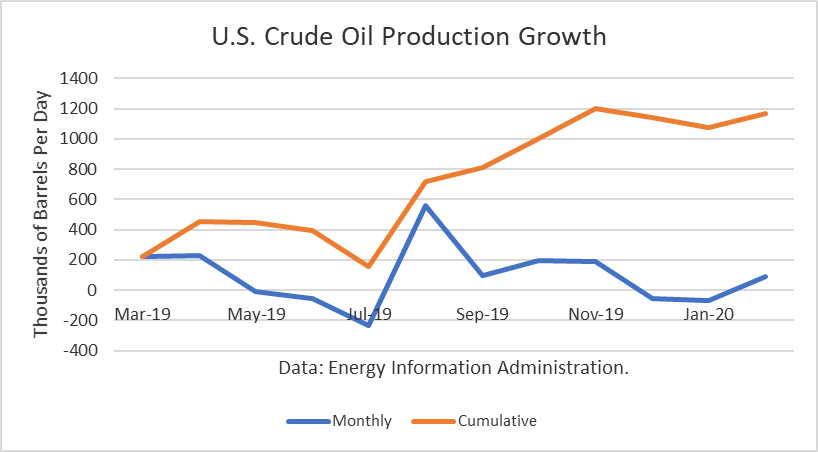
The Energy Information Administration reported that February crude oil production averaged 12.833 million barrels per day (mmbd), up,000 b/d from November. Reductions occurred in the Gulf of Mexico (87,000 b/d). Because of the oil price war and demand destruction, the collapse in oil prices likely undercut output in March, making February the peak in U.S. production.

Output rise in the Gulf of Mexico (41,000 b/d), New Mexico (37,000 b/d), North Dakota (27,000 b/d), and Oklahoma (27,000 b/d). Texas production fell by 5,000 b/d from its January all-time high.

Crude Oil

The gains from last March have amounted 1.164 mmb/d. And this number only includes crude oil. Other supplies (liquids) that are part of the petroleum supply fell 390,000 b/d from a year ago. Continue reading "U.S. Crude Oil Production Peaked In February"

U.S. Crude Up 1.5 Million Per Day In 2019

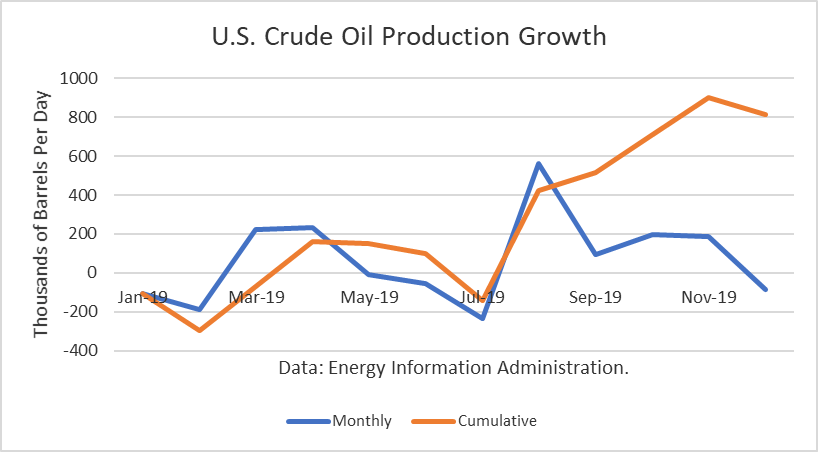
The Energy Information Administration reported that December crude oil production averaged 12.779 million barrels per day (mmbd), down 84,000 b/d from November. Reductions occurred in the Gulf of Mexico (47,000 b/d), North Dakota (40,000 b/d), Colorado (26,000 b/d) and Oklahoma (16,000 b/d) and were likely weather-related. Texas production rose by 32,000 b/d and reached a new high of 5.350 mmbd.

Phillips 66 Partner’s Gray Oak pipeline is expected to ship an additional 900,000 b/d in the Permian. It began shipments and is expected to be in full service by the end of the second quarter of 2020.

Crude

The gains from last December have amounted 816,000 b/d. And this number only includes crude oil. Other supplies (liquids) that are part of the petroleum supply add to that. For December, that additional gain is about 700,000 b/d. Continue reading "U.S. Crude Up 1.5 Million Per Day In 2019"