
 Today we've asked Kenny Mann of Traders day Trading to share his ideas on Elliot Wave Theory and why you should be interested as an investor.
Elliott wave theory suggests that stock market prices tend to ebb and flow in recurring wave like patterns that can enable us to identify high probability trading opportunities. The knowledge gained from recognizing where the market is within one of the wave patterns, can help us to stay in a trade longer so as to maximize profits, whilst also ensuring that we know when to get out, if the market should turn against us.
What is Elliott Wave Theory?
For most people with even a passing interest in stock markets and trading, the name Elliott is usually a very familiar one. Ralph Nelson Elliott was a well respected accountant who through ill health, had a lot of free time on his hands and spent much of it studying the stock market. It was the 1930’s and a particularly interesting time in the markets.
Elliott observed that prices often moved in trends and patterns that were, to a certain degree, all very much the same. The patterns appeared to consist of waves which themselves then evolved into larger waves, he called his observations, Wave Theory. Today it is known as Elliott Wave Theory. The wave theory remained relatively unknown until the 1970’s with the release of Frost and Prechter’s, Elliott Wave Principle. This bestseller continues to be regarded the definitive guide to Elliott Wave Theory, and as one of the classics on technical analysis. Find out how to get the Elliott Wave Principle online, free.
If you take one stock market chart for something like oil, and you remove all information relating to any time frame or values, and you place this next to a trading chart for something completely different, what you will notice is that they share many significant similarities.
The reason for this, so Elliott Wave Theory suggests, is that stock markets are heavily controlled by human psychology, and human psychology is fairly predictable.
We humans are a pretty predictable bunch at heart. Knowing this fact, and combining it with the principles of the Elliott Wave Theory, it is possible to observe trends in the stock markets, and foresee changes in advance of them occurring.
Elliott Wave Basics
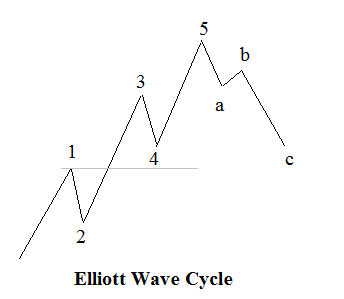
The basic principle of Elliott Wave Theory is simple. Over periods of minutes, hours, days, weeks, months or even many years, trends will often follow a cyclical wave pattern, most usually considered to consist of three progressive waves (Impulsive Waves), broken by two regressive waves (Corrective Waves). The five wave pattern will then be followed by a corrective three wave move in the opposite direction, to form a complete Elliott Wave cycle.
Impulse Waves
The first wave will see a progressive change in stock value in the direction of the new trend. This is where the smart money is getting in. Prices can sometimes seem to struggle to make any headway as many traders continue to trade with the previous trend. However, by the time wave 1 has run its course, the market should be displaying some subtle signs of having turned. Often, the turn will be very apparent.
Second waves are corrective and as such, by definition, can never retrace more than 100% of the first. Trader’s who were convinced the previous move was another corrective phase congratulate themselves on calling it correctly. However, the new trend finds some strength, and goes on to power ahead in a third wave. Wave 3 is usually the most significant and longest period within a trend. It is a period of mass participation as it becomes obvious to the vast majority which direction the markets larger trend is now moving in.
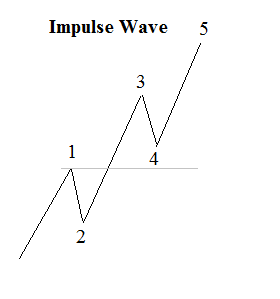
As wave 3 runs out of steam, traders begin to take some profits and the market enters another corrective phase in a Fourth wave. However, once again the underlying strength returns and the trend resumes as it enters in a Fifth wave. Fifth waves are distribution phases where the remaining traders that have been in denial, finally accept that the markets larger trend is now going against them. These traders are now forced to liquidate their losing positions and may even decide to reverse their trades, just as the trend is completing.
We have all been there, where we have been forced out of a position just to see the market turn. It is a classic novice trader mistake, but one which can still happen to even the more experienced traders who have got their timing wrong.
Using Elliott Wave analysis can usually help us to recognize where the market is in the current trend. This knowledge greatly reduces the chances of us entering into a position too early, and then getting forced out again at precisely the wrong time.
Corrective Waves
Corrective phases are slightly more complex, they generally consist of three waves, but there are several possible combinations of patterns that may form within those three waves. The example shown here following the five wave advance is a three wave zig zag pattern.
Practical Application of Elliott Wave Theory
There are a number of ways in which the knowledge and application of Elliott's Wave Theory can be used to both predict stock market trends as well as to provide a certain degree of reassurance during times when values may be decreasing. Understanding that
these decreases may well be correctional, and be preceding a subsequent growth period can provide a distinct advantage when trading both over the short and longer term.
One of the problems is that it can be difficult to identify the patterns accurately enough to make significant decisions. However, by following a few simple rules and guidelines, Elliott wave can become an extremely powerful tool that every trader and investor should at least have a basic understanding of.
Kenny Mann
Tradersdaytrading.com
Learn more about Elliott Wave trading and how to get the Elliott Wave Principle online, free.
you guys that are bagging out Pretcher sound like you blame him for all your losses. Too bad you don't understand the Elliott Principal a bit more. Shame : and take more responsibility for your own homework.
Not at all. I blame myself for listening to Prechter. Elliot wave can be used in 2ways. Learn it yourself and see if you can succeed on your own. Or, pay for Prechter's service and forecast. If you do the first, then you are obviously responsible for your own interpretation. But then that is the problem. At any juncture there are a myriad of possibilities. Even on a supposedly corrective wave, it is possible that it is an x wave leading to an extension of the corrective wave and another extension. If you go the rout of paying for their forecasting service, the you better act according to their recommendations because they are the experts and you are not. Nevertheless after studying Elliot wave for 6 months, we understood it pretty well and would be scratching our heads at some of their recommendations. But we followed them to our detriment. So you bet you we're going to blame them for their totally wrong forecasts. To go back to the case of gold. Gold was 900 a few years ago and dropped to about 650 and then came back up to 1200 and then on to 1920 before dropping to 1600. During that time, Prechter was forecasting a drop to 50% or about 450. Even while gold was going up to 1200 and higher he was still telling people to short gold. Again, being correct at 1920 doesn't make up for being wrong the whole way up.
sundyam, here's my email [email protected] its going to be easier to reply
To Sundaym
the broker l use offers the mass index in their list of indicators, if yours does not then l don't know where you would go from there
Thanks for quick reply! If I may, which broker do you use? Are there any similar tools/indicators in the MarketClub charting software. Is it important to have real-time, not 15 minute delayed info, charts to implement your strategy? Which time frame(s)( 15-minute, daily weekly, etc)do you employ when trading your suggested method? Again, thank you in advance for taking the time to answer my questions. Much appreciated!
So after all the learned discussion, where are we now and what wave is the market on?
This article has inspired me to carry on writing on my own blog
To the person who made the first post about Prechter calling the 2007 top 6 months early....ughhh check you facts. I am a subscriber to his newsletter, and he called the top the day OF the TOP. He called the 2009 bottom, 2 weeks before the bottom. He also called a TOP in gold @ 1920 or so....has it gone higher or lower since the?
I have his newsletters too. He called the 2007 top in July. Then when it didn't happen and topped again in December, he called it a "double top" to explain it away. Yes, "a double top" is supposed to be a "significant" Elliot Wave pattern. The problem is that he didn't tell you that there was going to be a double top ahead of time, so you're listening to him tell you to short with no mechanism of knowing exactly when to get out. Only in Feb of 2009 did he actually tell you to get out. But the rest of the time, it is "it could be this... it could be that..." by one of his subordinates. But his overall view was still to short. He told people to commit 50% of their funds to short and then when that didn't happen, he then told them to commit all of it. And the market kept rising.
With regard to gold, I hardly call a 300 point drop (15%) from $1920 a good call. First, a number of people were predicting that, so his system is hardly unique. Second, it depends on whether he ultimately is right (whether this is a draw back leading to higher highs or a true crash on the way and whether he will tell you correctly when to start going long again). Prechter has a history of getting somethings right. Without him being right some of the time, no one would be sucked in. My point is if you look at his overall record, he is wrong more than he is right.
Cyclical wave theory isn't completely without merit, as it describes natural human behaviors in trading well, but there are far too many variables for wave theory to adequately describe and real events in business and life frequently throw mathematical models way out of whack. This is why trends trading is generally safer, as it doesn't predict the moves so much as systematically catch the moves a short time after they start. All model-based system of predicting real-world behavior of anything be it weather or humans fall short as actual behavior is frequently also at variance with model assumptions.
Elliot Wave is totally bogus. We bought into it after the 2009 bottom thinking he had been right to predict the 2007 top. In fact, Prechter did not predict the 2007 top. He was 6 months early. During the run up from July to Dec 2007, you would have been killed if you had been short the market. He did predict the bottom in Feb or March 2009, but then he thought the Dow was going to go down to 1000 or less, not stop at 6500. So by June or July, he was already telling people to start shorting. When that didn't happen, we got killed in the market again. Then in November, Dec 2009, he was telling people to put 1/2 of all their money into shorts. We made a little bit of money and should have gotten out, but he said to keep shorting. Then by Feb, he said to put all of one's money in. We got killed as the market continued to go up. We stopped listening to him just in time to avoid losing more money. But peripherally we're still getting his free emails which hints at what he's thinking (but doesn't provide the analysis you have to pay for). And it is hilarious to see him hinting at the need to short again and again, only to have the market go up. I'm not saying the market won't go down, but if you listen to Prechter you'll get killed. Looking at the history, the money he made when he was correct in shorting would have been more than offset by the money he lost when he was wrong. Even if he was correct from 2007 to 2009, the money he made was offset by being wrong from 2009 to 2012 and from 2003 to 2007 when he was still predicting a crash.
I think Prechter must have no self-respect as he knows that he's been wrong, but he's biased thinking that his system is right. And because he doesn't actually manage your money and his system is subjective, he doesn't have to face irate clients. There is always a new batch of investors entering the market looking for new advice and unaware of his poor track record. (All he does is emphasize his correct predictions. Even his book Conquer the Crash (revised version) part III leaves out his wrong predictions from about 2001 after the crash to 2005. It only picks up again with his newsletters in part III when there was the semblance of possibility that he might be right again leading up to the 2007 peak.
I resemble that remark.
I took a keen interest in wave theory in about 2008. After the 2008 crash I piled in to capitalise on the corrective wave b. This worked well and when it started turning early 2010 I got out congratulating myself that I mastered the technique. I now waited for wave c to complete and get in again, except that didn't happen. After the correction the market turned and moved up impulsively. I was in cash and watched as others profited. In mid 2011, the market again corrected. Hah, is this the long awaited wave c? Again about Nov 2011 it turned and moved upward. All this time, Prechter was warning investors of the doom and gloom to follow citing 60 year super cycles, deflation etc. Here in South Africa, our all share index in January took out its 2007 highs which according to Elliot, means that we were not in an extended b correction but actually have followed an impulse wave pattern upward since 2009. Your Dow has not quite reached there yet but, is the USA in an extended correction b (as Prechter predicts) or will it move up impulsively again? Lance is quite correct when he says that this theory is purely subjective as movements are interpreted according to ones own terms of reference. As for me, I have gone back to my own techniques and as Adam Hewison always says, follow the trend, don't fight it.
Hi
i clicked on an article about some wave theory dude today, that was at a metals price site i go to all the time (INO.com). I learned more about the thing from your response than the entire article! I don't even have to go wikipedia the stupid thing now.
later
Elliott Wave is impossible to use in my opinion. I would much rather look at conventional charts for patterns, resistance and support levels, divergences to the RSI, etc than EW which has proven incomprehensible to me.
We now know that even the world's foremost expert on Elliott Wave Theory Prechter, that nailed his trade in the 80s with it, went on to lose it all, including his credibility in 1995 with his get out of the market now Elliott Wave forecast.
The problem is that Elliott Wave Theory is not an objective tool. It's very subjective. You see what you want to see. Get 10 Elliott Wave Theorists in the same room and you'll be lucky to find 3 that count the same number of waves and can tell you the precise wave we are in.
The subjective nature of EWT is why neither Market Club nor any other charting software includes an EW overlay. Sure you have wave counts or the zig zag tool, but that's not Elliott Wave Theory.
By all means try to make money trading with it, just don't risk too much money because after awhile, you'll probably come to the same conclusion as most, it doesn't work and there's better indicators with 70% accuracy or better.
You are very much right sir.
It's one thing to say there are better methods
and paths to market prediction. It's quite
another thing to disprove a method, and still
another thing to give examples of methods that
are 70% more accurate. I would certainly like
the names of such methods, would surely try them!
EDT
Chicago, Illinois
Try the williams % combined with mass index and momentum
Could you elaborate a little further on how you use these indicators together. Where does one find the Mass Index Indicator? Thank you
Voodoo economics??????????????
The basics of the Elliott Wave Theory are an introduction to a theory that is often mentioned but not explained well or clearly as in the preceeding explaination.