
Each Week Lo ngleaftrading.com will be providing us a chart of the week as analyzed by a member of their team. We hope that you enjoy and learn from this new feature.
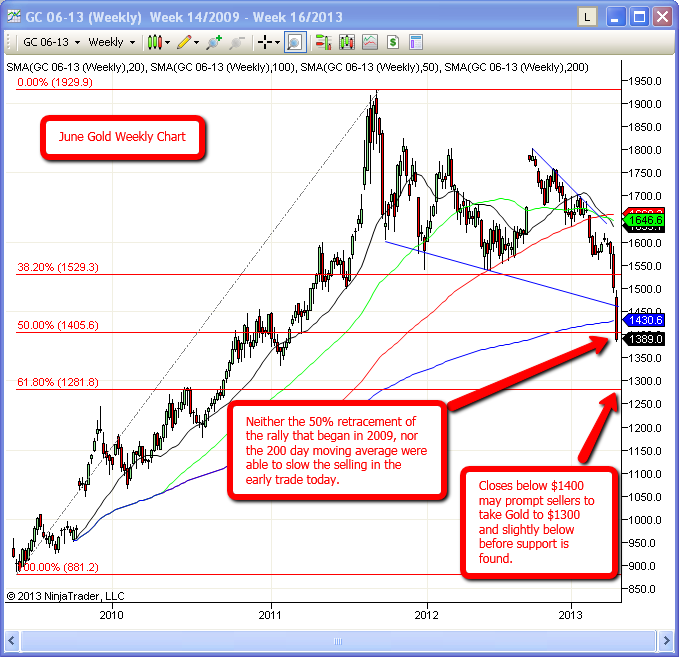
Weekly Gold Report (April 15th through April 19th)
It has been a few years since the Precious Metals have seen a Friday selloff followed by an even bigger Sunday night drop, but anyone that has been trading since 2008 remembers prior price action like this. And when any sector of the market experiences drops like these, everyone will be racing to the television and internet hoping to find someone bold enough to confidently call “THE LOW”. As far as this article and this drop are concerned, I think it is way too early to begin spouting target prices for a low. With all of the expected margin calls and positioning that will follow, I feel the best thing to do is be patient and let things in the Metals settle down before stepping in for a long term play. There should be many intraday trades available thanks to the expected volatility, but the long term play will be too difficult to depend on this early in the week.
The Metals have been under so much pressure lately for a litany of reasons. In the US, we heard last week, that the FED may look to scale back on easing throughout this year and with stock indexes testing new highs last week, there is less reason for a “flight to safety” bid in Metals. In Europe, there was news that Cyprus may be forced to sell Gold bullion in an effort to raise capital, which could prompt other European banks to follow suit. And most recently, the markets had to digest a number of economic data misses from China. In an effort to keep everyone on their toes, we are about to embark on a week when we will hear from multiple FED members and the Treasury Secretary in the US, along with ECB President Mario Draghi, who will all discuss their views on global markets.
With very little support on the weekly chart around $1400 in the early going, the selling pressure on the Gold Futures may continue and attempt to force prices to $1300 or slightly lower as seen on the chart. I think it is too early to try to pick intraday support and resistance levels this early in the week. After a few days of data are input into the equation, this will be a great market to trade shorter term.
Thank you for your interest,
Brian Booth
Senior Market Strategist
bb****@lo*************.com
888.272.6926
** There is a substantial risk of loss in trading futures and options. Past performance is not indicative of future results. The information and data contained in this article was obtained from sources considered reliable. Their accuracy or completeness is not guaranteed. Information provided in this article is not to be deemed as an offer or solicitation with respect to the sale or purchase of any securities or commodities. Any decision to purchase or sell as a result of the opinions expressed in this article will be the full responsibility of the person authorizing such transaction.
Dear Everyone,
I noted before, when everyone was euphoric over the new highs in the market, that the bond rally is not over. I said then that the 30 year bond should go to 2.5% this year (16% return), or even 2% over the next year and a half (25% return). Gold fell due to the Japanese yen devaluation, and the subsequent divesting of Japanese bonds (not all the crazy reasons above). When they devalued, you knew the bond market would pop. I just didn't know where it would manifest itself--but, that was gold.
Here is how I'm playing this. I am in bonds till this rally ends. Then, into cash for 1-2 months (I think I said 2-3 weeks last time, but that might be longer, due to the severity of the stock crash), until the stock market finds a bottom (it could be 10,000--or, even lower). And, then back into dividend paying stocks to watch it re-inflate for good. Don't forget the time differential between the bond rally reaching a top and the stock market reaching its bottom. During that time, you should remain in cash.
Something to think about, Cherubim
In 1980 no one had seen it happen then either, and no one thought there would be a 20 year bear market, after all the economic factors were clearly disposed to gold regaining and marching higher in short order.
Much more solid support lies around $1,000, the breakout level after the 2008-9 crash then recovery. Will be hard to get there however with sentiment readings at exreme levels.
What concerns me is the fact that many countries in Europe and the USA are continually printing money at alarming rates but gold has taken a beating . This metal is supposed to be a safe haven for when the stock markets are in great difficult and yet the Dow with the exception of the last couple of days is at all time highs for this period.....what gives?????????
No, it's not supposed to be a safe haven, it hasn't been one in decades. The media can't seem to get it right. It failed as a safe haven during the '87 crash, the Asian contagion and LTCM crashes of 97-98, fell badly right after 9-11, fell apart during the 2008 meltdown, and did bad last year when the European markets were collapsing.
There is a lot more to the secular bull market in gold, look closer.
Thanks for the clear update on the Gold price....its a pretty fascinating chart....i have never seen the gold price chart react like this.