
Each Week Lo ngleaftrading.com will be providing us a chart of the week as analyzed by a member of their team. We hope that you enjoy and learn from this new feature.
Weekly Gold Report August 12th through August 16th
Summer markets and light volume trading should continue to be the focus for the upcoming week. Despite the fact that the next five trading days have quite a bit of data to present, the reports are divided equally between the United States and Europe, along with a few from Japan and Great Britain. This mix of intermarket and intercontinental data should provide decent intraday volatility to trade, but I do not expect any fireworks.
The two standouts this week will be Retail Sales in the US and GDP reports from Germany, France and the Eurozone. Any one of these reports can provide some nice movement in the Currencies and Stock Indexes, but lighter volume trading should cap any major movement.
The Gold Futures have been a tricky market to predict from a fundamental perspective, which also makes a multi-day trade difficult. Over the last few years, Gold would look for things like a weak US Dollar or a weak Stock Market to provide a reason to rally or sell off. There was also the “Risk On-Risk Off” movement last year that provided the occasional curve ball. But lately it seems more impossible than ever to tie the direction of Gold to any one fundamental idea. But you CAN trust technical analysis.
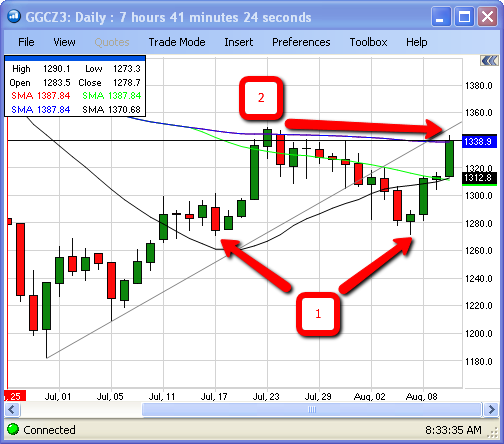
The above chart is a daily of the December Gold Futures. Arrow #1 points out last weeks low that was a test of the prior chart consolidation from mid-July. A hold at this prior low provided a steady bounce that is now on its way to a test of a prior trendline that was supportive but now is seen as resistance. Not only is $1350 significant because of this trendline (identified by arrow #2), it is also significant because it is a retest of the July 23rd high print. An early climb off the open on Monday morning seems to me like a great way to bait traders into a long position before turning the market upside down. I will let the closing price of Gold today prove to me whether this idea is right or wrong.
Good luck this week and please feel free to reach out to me directly if you would like to discuss trading Gold Futures or any other Futures or Futures Options. I will be happy to hear from you.
I can be reached via email at
bb****@lo*************.com
or by phone at (888) 272-6926.
Thank you for your interest,
Brian Booth
Senior Market Strategist
bb****@lo*************.com
888.272.6926
** There is a substantial risk of loss in trading futures and options. Past performance is not indicative of future results. The information and data contained in this article was obtained from sources considered reliable. Their accuracy or completeness is not guaranteed. Information provided in this article is not to be deemed as an offer or solicitation with respect to the sale or purchase of any securities or commodities. Any decision to purchase or sell as a result of the opinions expressed in this article will be the full responsibility of the person authorizing such transaction.
You're certainly right about gold trends being a difficult area and not being tied to any single fundamental idea - but was it ever? I am not sure I agree with you about technical analysis being entirely believable on the basis of trend lines - except possibly over limited time periods determined by a t least two fundamentals. But I'm new at this!