
Best Buy Co., Inc. (NYSE:BBY) was one of the top performing stocks in 2013. Best Buy (NYSE:BBY) reported on Thursday that total revenue and sales at its established US stores fell in the all-important holiday season due to intense discounting by rivals, supply problems for key products and generally weaker traffic in December. After starting out the trading year of 2013 at $12, this stock performed like the energizer bunny and kept going and going and going for most of the year. It hit a high of $44.60 on November 13th, a month before the all-important holiday season reality set in.
What Does This Company Do?
Best Buy Co., Inc.(NYSE:BBY) operates as an e-commerce and physical retailer of consumer electronics in the United States, Europe, Canada, and China.
Was Best Buy's Implosion Predictable?
No one can predict with 100% certainty what's going to happen in any given market. What technical analysis can do, and does do very well, is put the odds in your favor and give you a high degree of confidence that something is going to happen. It also acts to protect your capital when things go wrong in a market. That is done through the use of money management and discipline, both of which I talk about frequently on this blog. Let me illustrate for you how two simple technical tools would have helped you avoid today's disaster in Best Buy.
Trade Triangles Save The Day
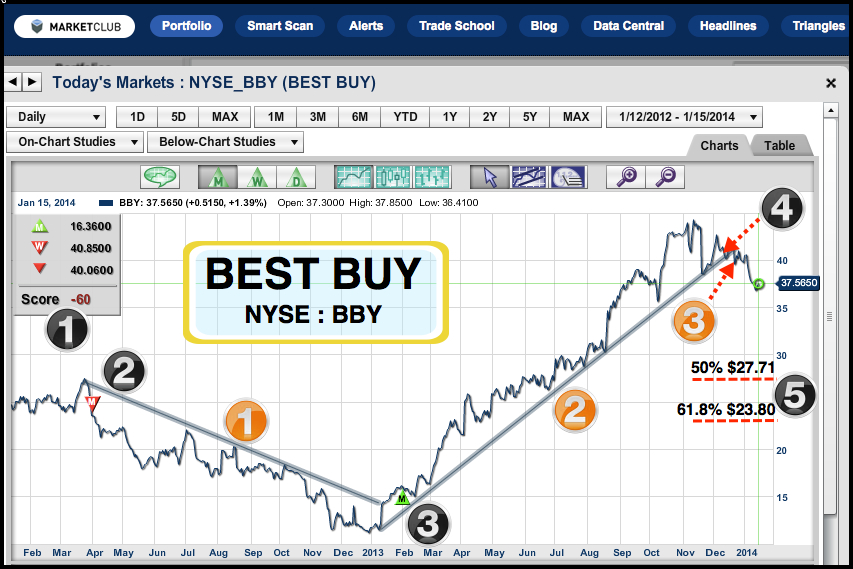
On the chart of Best Buy, there was a red monthly Trade Triangles at $22.85 on April 2, 2012 (black 2) indicating that the trend was headed lower for this stock. The downtrend changed on February 1, 2013 when a new green monthly Trade Triangle kicked in at $16.36 (black 3). That trend stayed strong until November 19, 2013 when a new red weekly Trade Triangle (not shown on chart) kicked in at $40.85 suggesting an exit/sidelines position was warranted for this stock (black 4). MarketClub's Trade Triangles are designed to get you in a stock when it is moving higher and more importantly to get you out of stock with a profit or minimal loss when the trend reverses. If you are an aggressive trader you can use the Trade Triangle technology to both buy and short stocks.
Black Buttons
1. Trade Triangles box
2. Bearish monthly Trade Triangle signal
3. Bullish monthly Trade Triangle signal
4. Weekly Trade Triangle exit signal
5. Major Fibonacci retracement and support levels
All Powerful Technical Trend Lines
Trend lines have to be one of the simplest forms of technical analysis. They are also one of the most powerful ways of detecting when a stock is going up and when it invariably changes direction and starts to move lower. If you haven't seen this short video on how to use trend lines, I highly recommend it.
Orange Buttons
1. 10-month downtrend line.
2. Upside breakout over downtrend line
3. 11-month uptrend line.
4. Downside breakout below uptrend line
Fibonacci Support For Best Buy
If I am correct in my analysis, Best Buy Co., Inc.(NYSE:BBY) could move down to a major Fibonacci retracement/support zone around $23.80. The $23.80 level represents a 61.8% pullback from last year's highs in November and the lows seen in early 2013. You can learn more about Fibonacci retracements in this short video lesson.
To summarize, I expect the current downtrend and defensive market action in Best Buy to continue unless I see otherwise with the Trade Triangle technology.
Every success with MarketClub in 2014,
Adam Hewison
President, INO.com
Co-Creator, MarketClub